


- Within Asian equities, we prefer a more defensive exposure as it can provide stability regardless of market conditions.
- The Fidelity Asia Pacific Dividend Fund invests in companies with sustainable moats, stable cash flows, and strong balance sheets to achieve consistent returns.
- It maintains an unconstrained, concentrated portfolio that significantly deviates from the benchmark, MSCI AC Asia Pacific ex Japan Index.
- Security selection has led to a quality and defensive tilt, reflected in its three-year beta of 0.8, indicating stability compared to the broader market.
- The fund performs well in downturns and maintains consistent returns in strong markets, resulting in significantly lower drawdowns compared to its benchmark and peers.
Asian equities have been standout performers this year, with gauges like the MSCI Asia ex Japan Index and MSCI Asia Pacific ex Japan Index both up over 10% in SGD terms. This surge can mainly be attributed to the largest Asian market, China, where stocks saw a runup from their lows, as investors were triggered by optimism around policy and had perceived valuations to be cheap.
In this article, we share our preferred investment strategy for Asia and spotlight a fund that investors may want to consider.
Investing in Asia
China constitutes a sizable weight of typically 20-30% in regional indices (Figure 1). While Chinese equities – gauged by the MSCI China Index – had a strong start this year, they have since fallen by about 10% from the peak. Despite cheap valuations, the focus has shifted back to ongoing challenges such as the property crisis and rising trade tensions with the West.
Government stimulus measures to prop up its property sector have yet to produce results. New home prices in China dropped by 4.5% year-on-year in June, marking the steepest decline since June 2015. Additionally, decisions by Washington, the European Commission, and possibly Canada to impose tariffs on Chinese electric vehicles (EVs) could hinder the sector's growth, adding to the country's economic struggles.
Figure 1: China is the largest Asian market
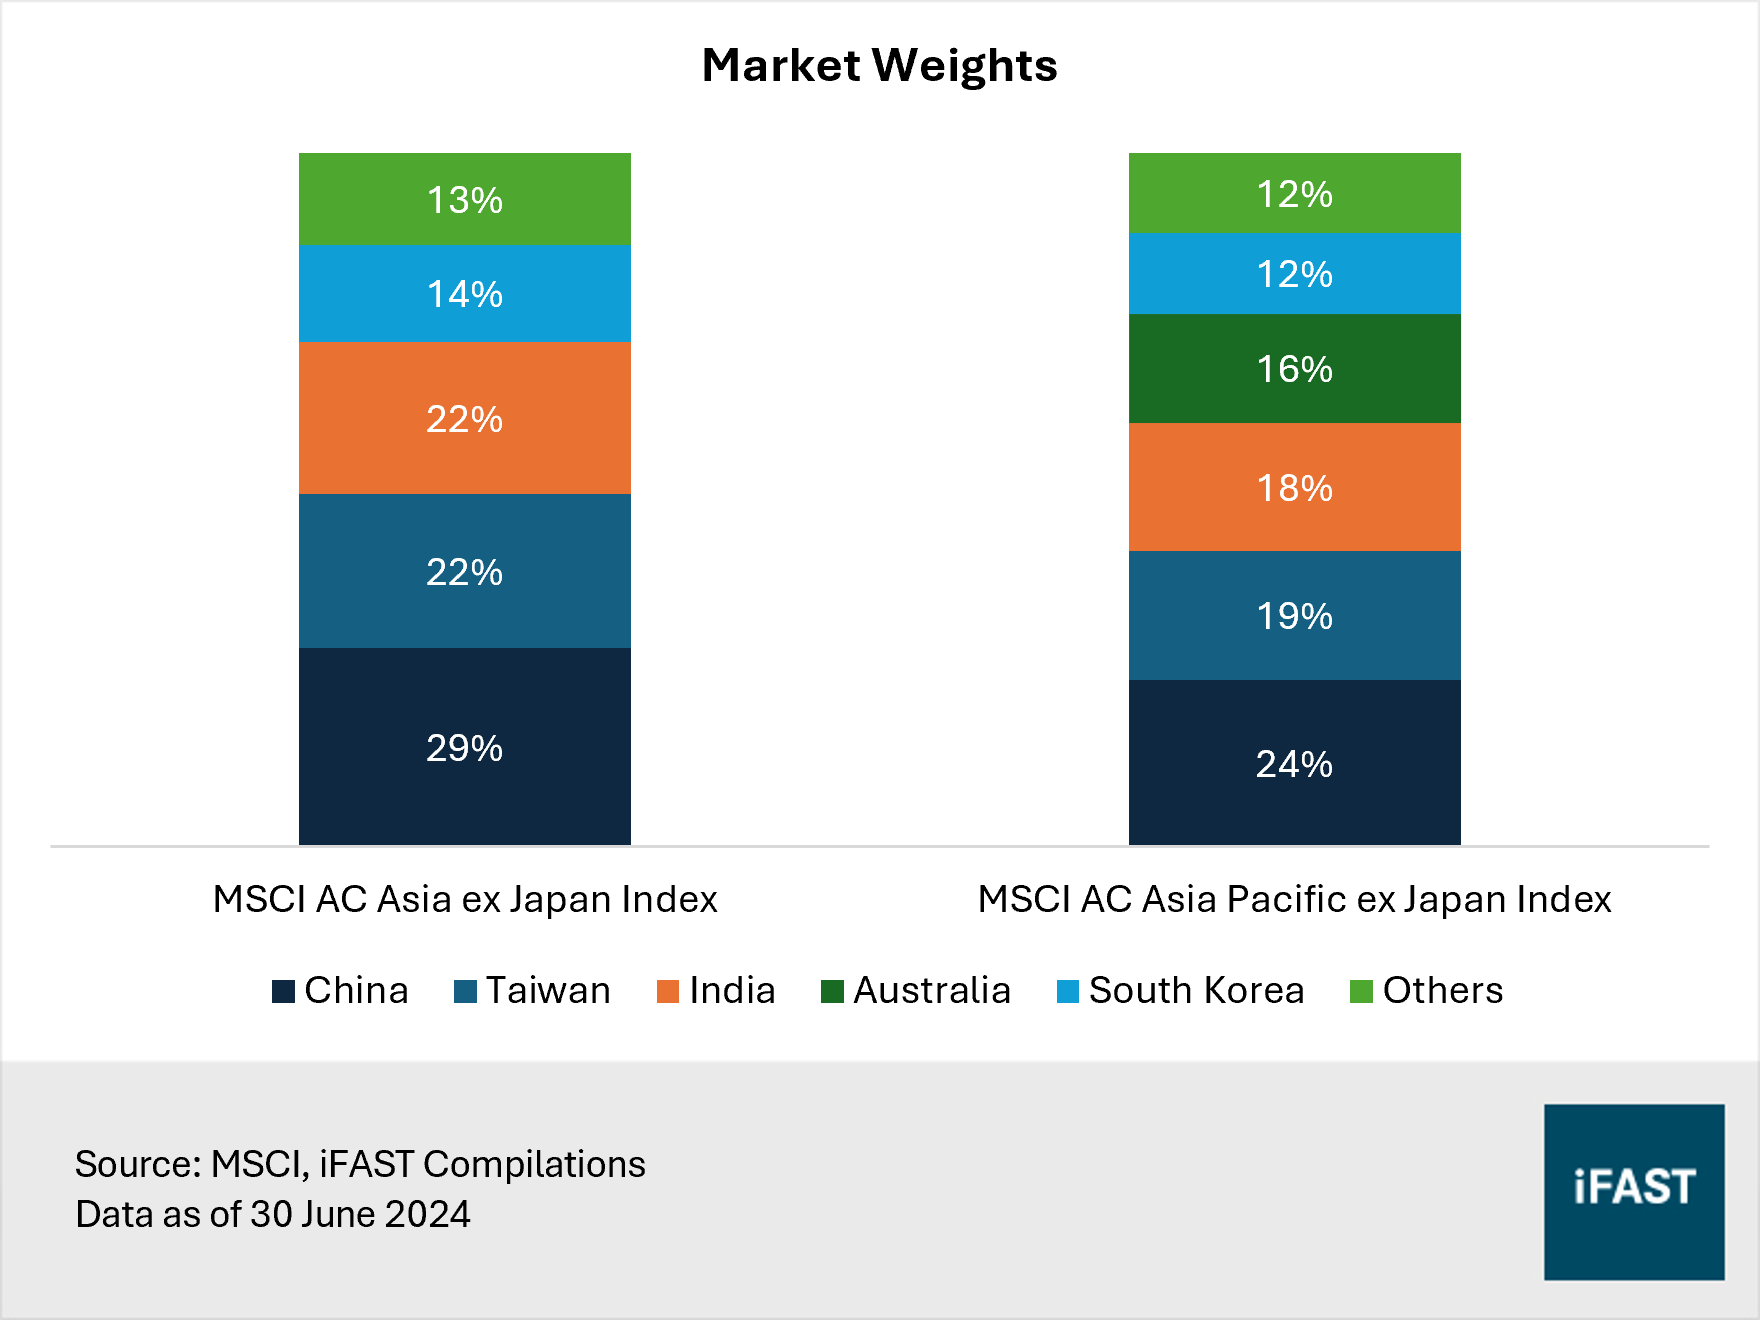
Meanwhile, we find Indian equities, which constitute around 20% of regional indices, unattractive. Structural challenges like high youth unemployment and twin deficits, as well as elevated valuations pose a risk of market correction.
As such, within Asia, we like a more defensive exposure as it can provide stability regardless of market conditions. A defensive strategy also suggests a tilt towards quality companies with stable earnings, low debt levels, and strong competitive positions. We recommend Fidelity Asia Pacific Dividend A-USD which typically invests in dividend-paying Asian companies with such characteristics.
Related articles:
Should you follow the rally in Asian equities?
Indian equities after election results: Are they a bargain now?
Quick Take: Why is Europe also blocking the cheap Chinese EVs?
Fidelity Asia Pacific Dividend: Distinct strategy from benchmark
The portfolio manager of the Fidelity Asia Pacific Dividend Fund believes the key to generating consistent returns lies in investing in companies with sustainable business moats, high and stable cash flows, and strong balance sheets. This enables companies to grow their business faster and increase shareholder returns. Valuation is seen as a key source of risk, prompting the portfolio manager to invest in companies trading below their intrinsic value to reduce downside risk and enhance returns.
The result is an unconstrained and concentrated portfolio with a quality value style tilt. As of 30 June 2024, the top 10 holdings make up over 40% of the portfolio. The fund’s unconstrained approach allows its holdings to differ significantly from its comparative benchmark, the MSCI AC Asia Pacific ex Japan Index. Position sizes typically range from 1% to 5%. Notably, only two of the top 10 holdings, TSMC and Samsung, overlap with the benchmark (Table 1).
Table 1: Top 10 holdings
|
Fidelity Asia Pacific Dividend |
MSCI AC Asia Pacific ex Japan Index |
||
|
Name |
Weight |
Name |
Weight |
|
TSMC |
8.8% |
TSMC |
9.3% |
|
Samsung Electronics |
6.8% |
Tencent Holdings |
4.0% |
|
Swire Pacific |
3.8% |
Samsung Electronics |
3.6% |
|
AIA Group |
3.8% |
BHP Group |
1.8% |
|
Singapore Exchange |
3.5% |
Commonwealth Bank |
1.8% |
|
Treasury Wine Estates |
3.5% |
Alibaba Group |
1.8% |
|
China Yangtze Power |
3.4% |
Reliance Industries |
1.5% |
|
Samsung Fire & Marine Ins |
3.2% |
CSL |
1.2% |
|
Embassy Office Parks REIT |
3.2% |
SK Hynix |
1.2% |
|
Evolution Mining |
3.0% |
Hon Hai Precision |
1.1% |
|
Total |
43.0% |
Total |
27.3% |
|
Source: Fidelity International, MSCI Data as of 30 June 2024 |
|||
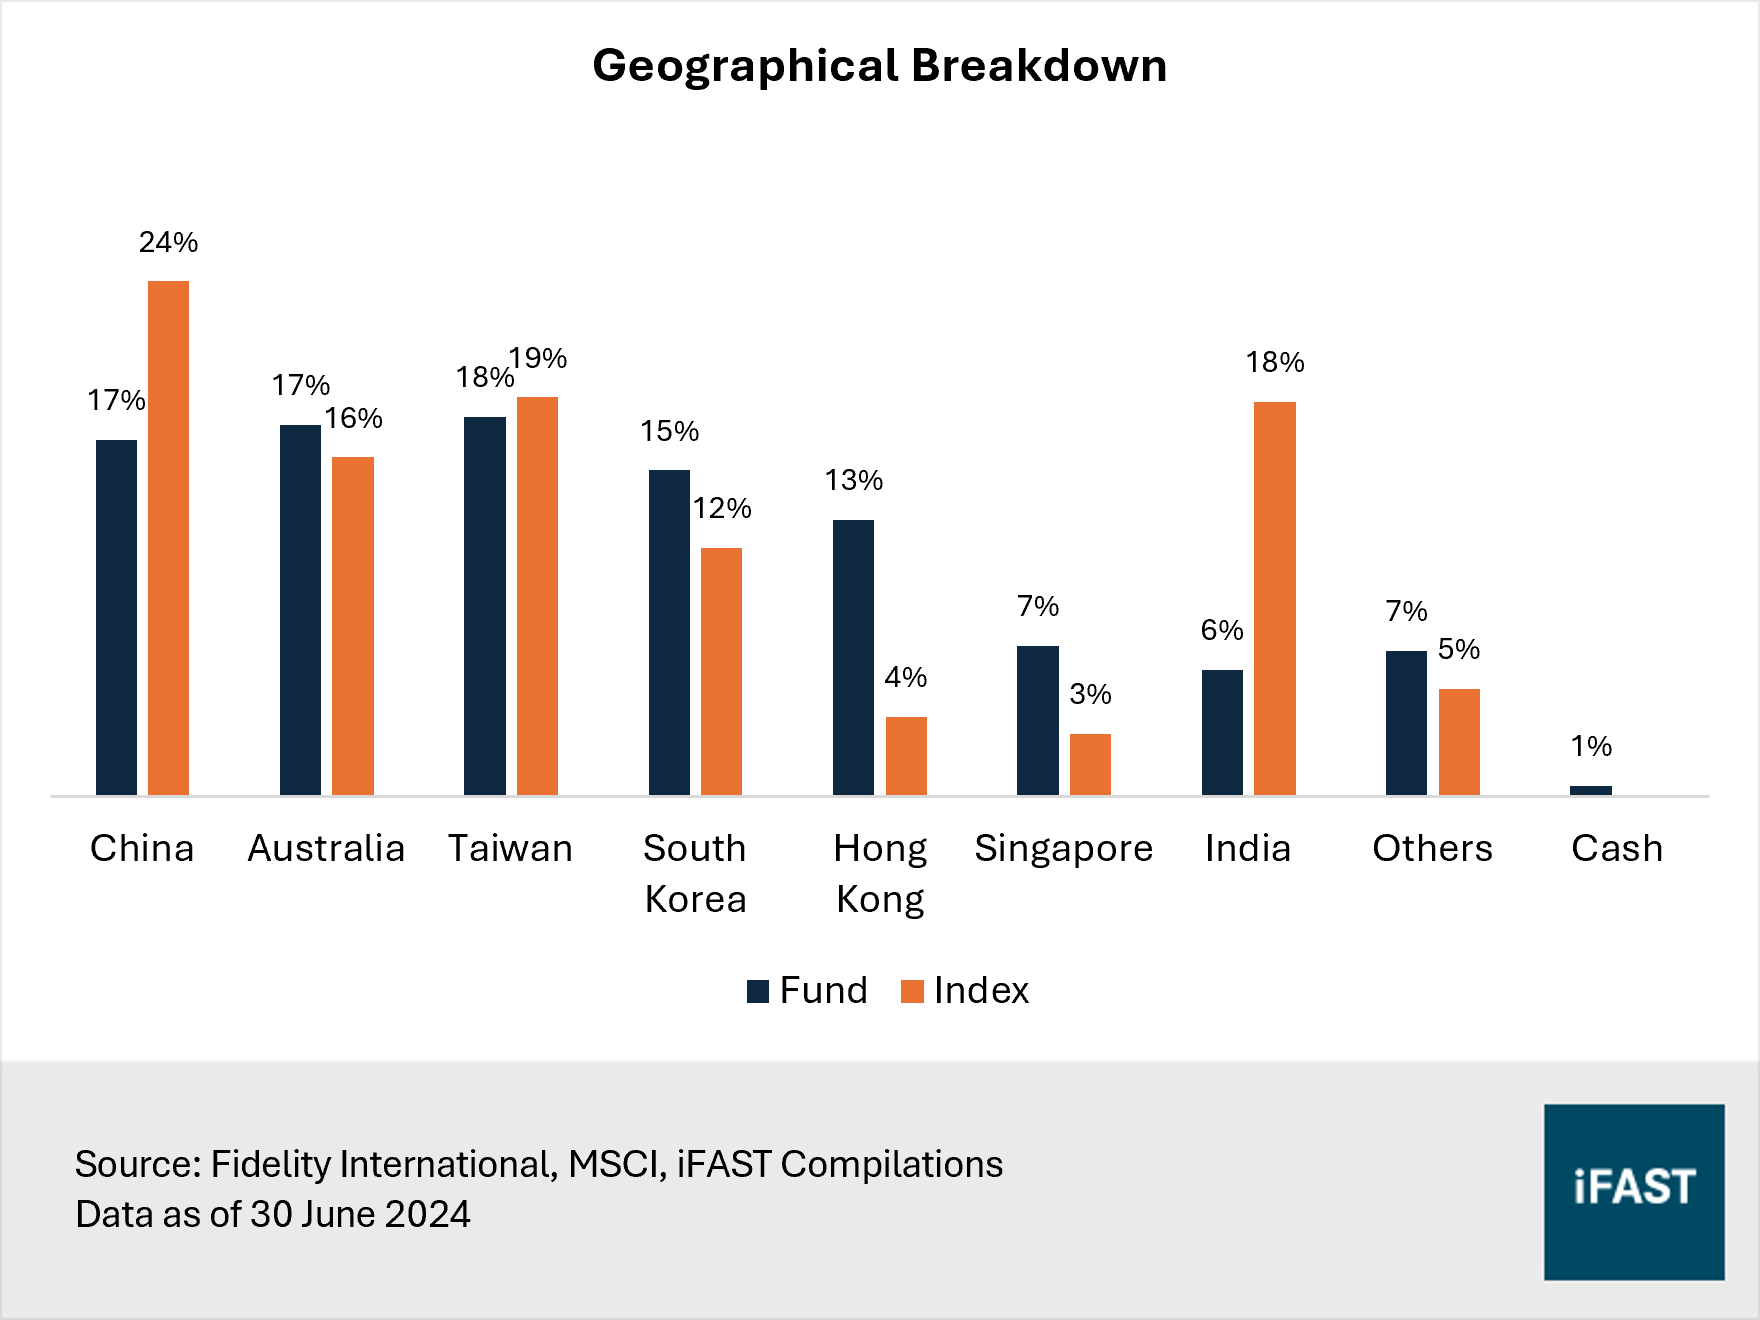
In view of the focus on dividend-focused total return, companies that pay little or no dividends will not feature in the portfolio. This includes areas like Chinese tech companies Tencent, Alibaba, and Meituan. Considering the heavy allocation of the tech sector within China’s equity market, this results in the fund being underweight in China (Figure 2). Similarly, the fund is underweight India due to the Indian market’s high-growth and low-yield nature. As of 30 June 2024, Fidelity Asia Pacific Dividend has 7% lower exposure to China compared to the MSCI AC Asia Pacific ex Japan Index as well as a substantial 13% lower exposure to India.
Figure 2: The fund has a lower exposure to China compared to its benchmark
Emphasis on quality
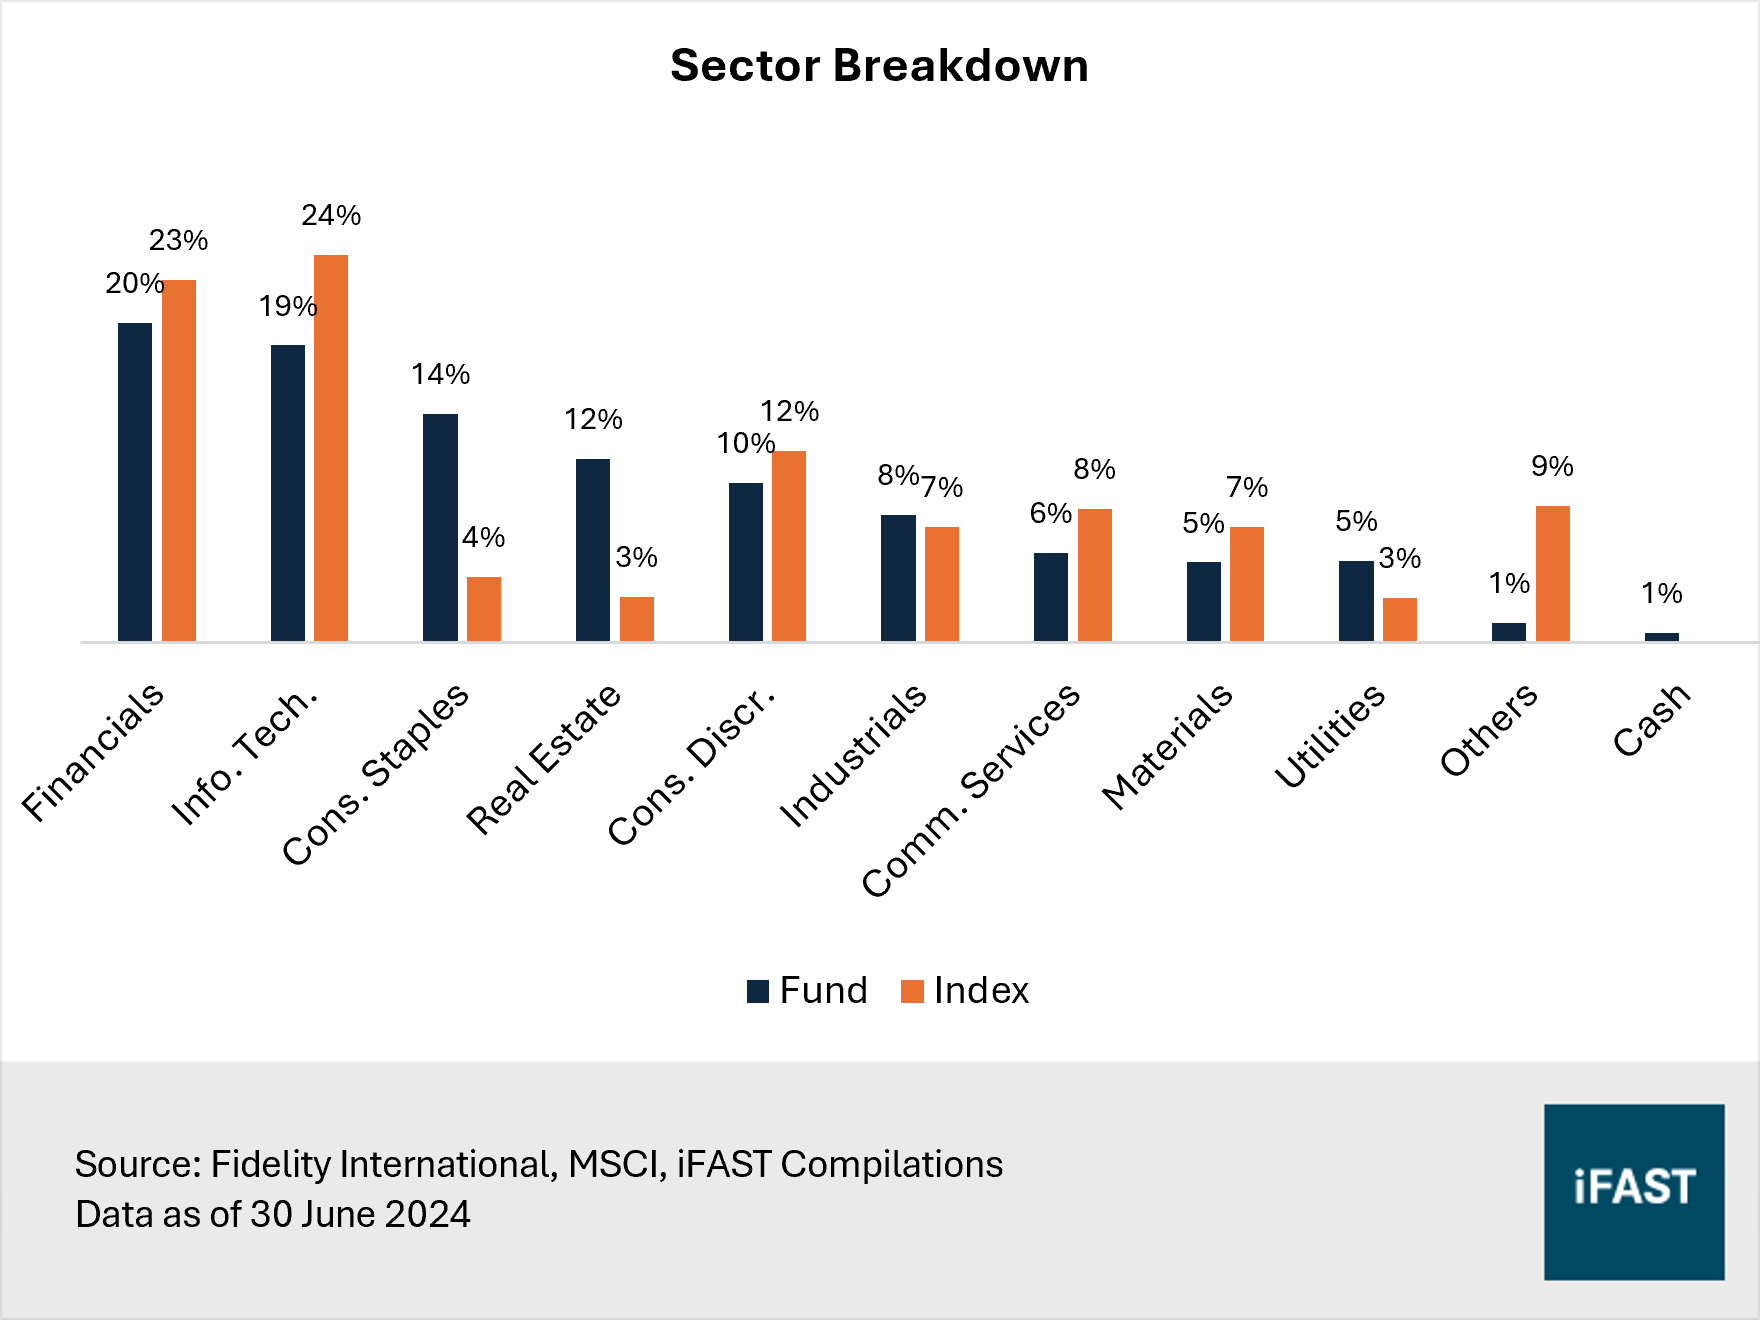
However, that is not to say that the fund has little to no exposure to Asian tech companies. One of the fund’s highest sectoral allocations is information technology, alongside other sectors like financials and consumer staples (Figure 3). The tech exposure mainly comes from holdings in chip giants TSMC and Samsung, which are quality companies with technological leadership and strong financial positions.
Figure 3: Financials and information technology are some of the largest sectors
Meanwhile, the portfolio manager is particularly optimistic on insurance and financial services within the financial sector due to their attractive growth prospects and high return on equity. Standout picks include AIA Group and Singapore Exchange (SGX). Despite HK-based AIA Group being at the receiving end of investor disdain towards China, the portfolio manager is confident in the insurer’s continued growth in new business value and healthy performance across the broader Asian market.
In the consumer staples sector, the manager favors companies with strong brands and promising growth outlooks, leading to stable, growing cash flows and progressive dividend policies. An example would be Treasury Wine Estates, an Australian-based global winemaking and distribution business.
Overall, security selection has resulted in a quality and defensive tilt for the fund which had a three-year beta of around 0.8. This low beta suggests the fund’s stability compared to the broader market.
Solid long-term performance track record
On a calendar year basis, Fidelity Asia Pacific Dividend has generally delivered relatively consistent and stable returns compared to its benchmark and Asian funds on our platform.
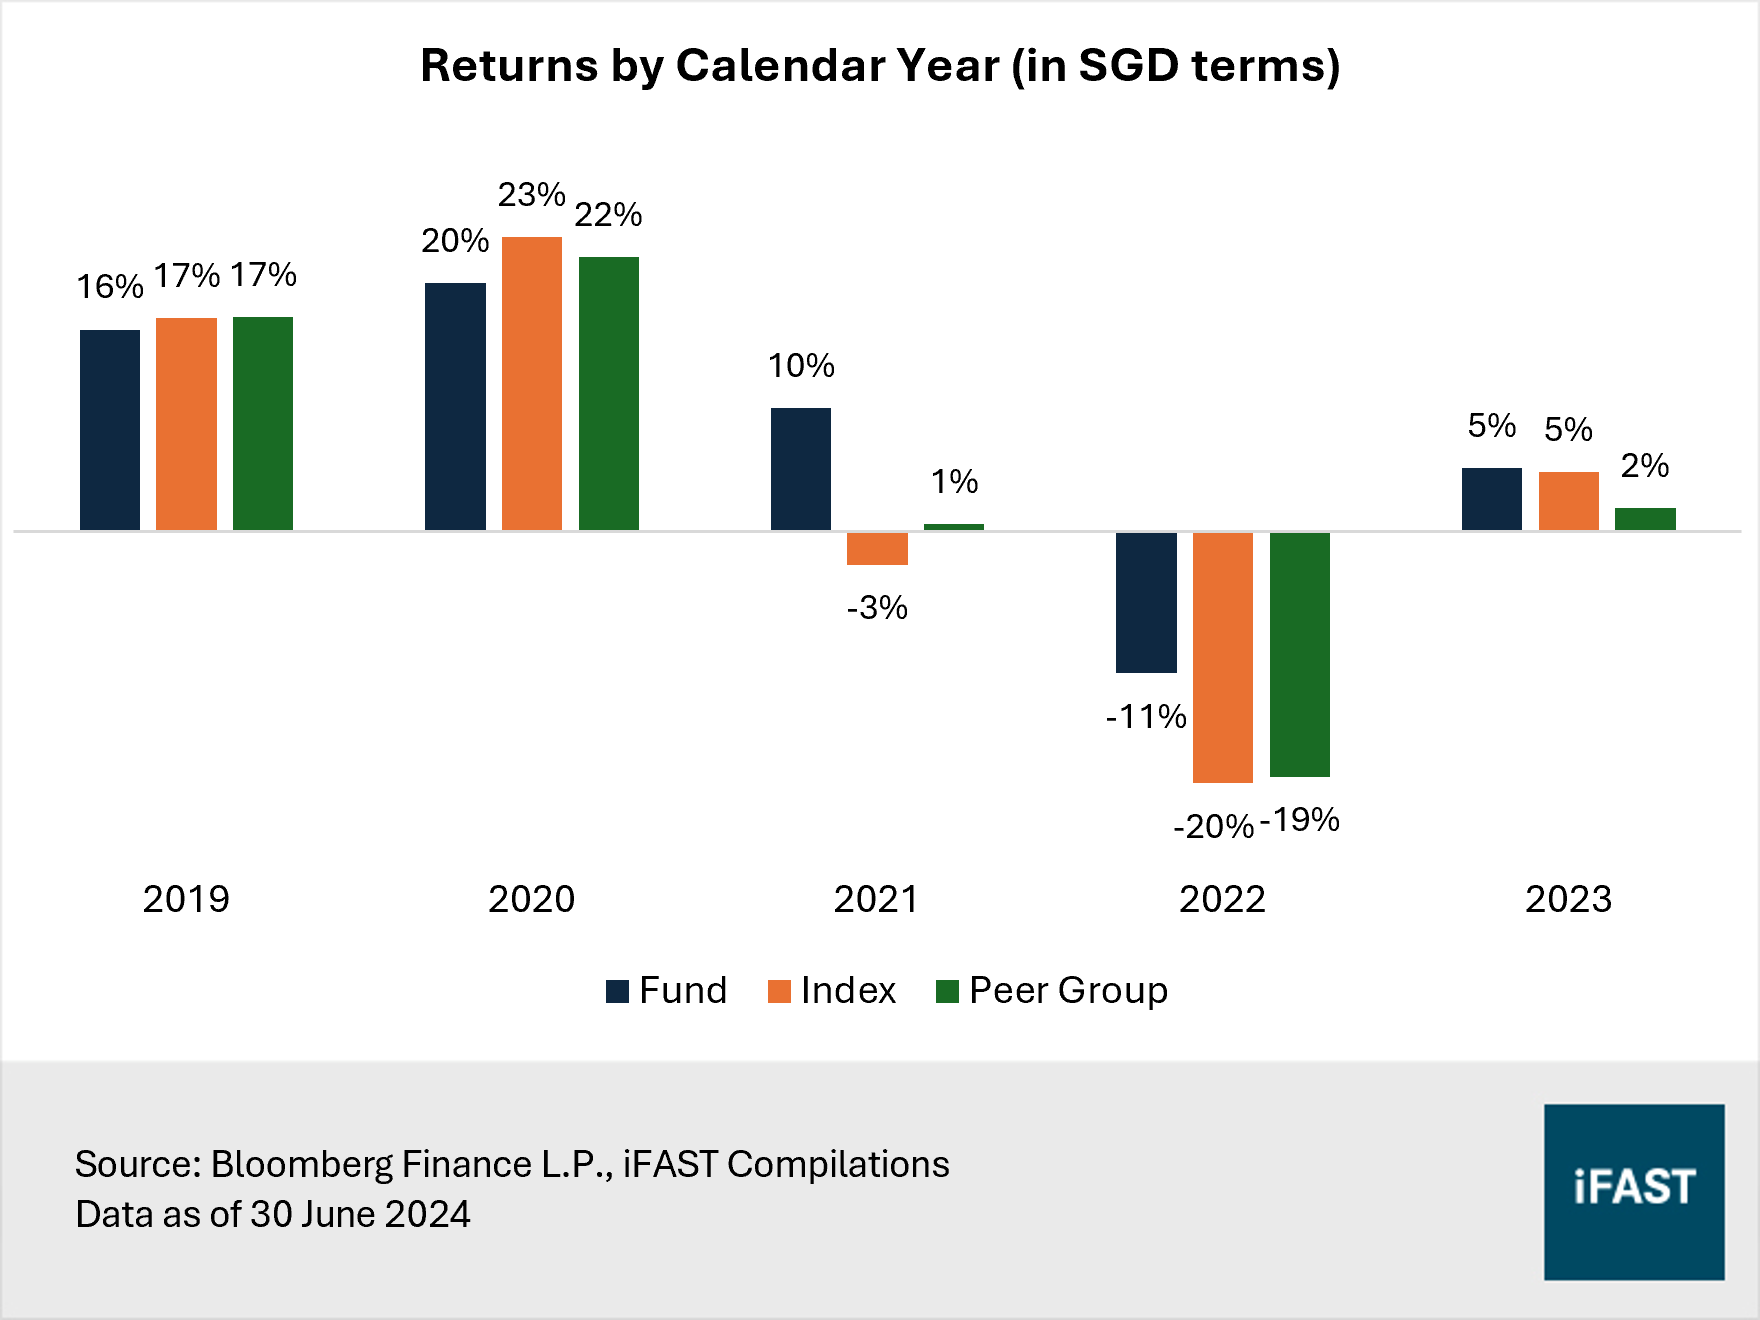
The fund tends to underperform in bull markets such as during the years 2019 (improving economic outlook, easing trade tensions between China and the US) and 2020 (recovery from Covid-19 shock). However, we note that the underperformance has been marginal, trailing the benchmark by just 1% and 4% respectively in 2019 and 2020 (all returns in SGD terms, unless otherwise stated).
The fund’s true strength shines during bearish markets, such as between 2021 and 2023 when Chinese stocks were rattled by multiple headwinds like crackdowns in the tech sector and an ailing economy dragged down by the property crisis. In 2021 for instance, the fund delivered returns of 10%, substantially outpacing the benchmark and peers which posted returns of -3% and 1% respectively (Figure 4).
Figure 4: Consistent performance over the last five calendar years
We attribute the fund’s resilience during downturns and its ability to capture upside in upturns to its focus on dividends and quality. By prioritising dividend-focused companies, the fund avoids most Chinese tech companies which have faced significant declines in recent years. Most importantly, dividend companies generally have stable cash flows, making them more resilient during economic downturns. Moreover, the fund’s preference for quality companies ensures that it not only holds up well during downturns but also deliver attractive returns when markets are strong. This strategy has also resulted in a significantly lower drawdown for the fund, differing by at least 10% compared to the benchmark and peers (Figure 5).
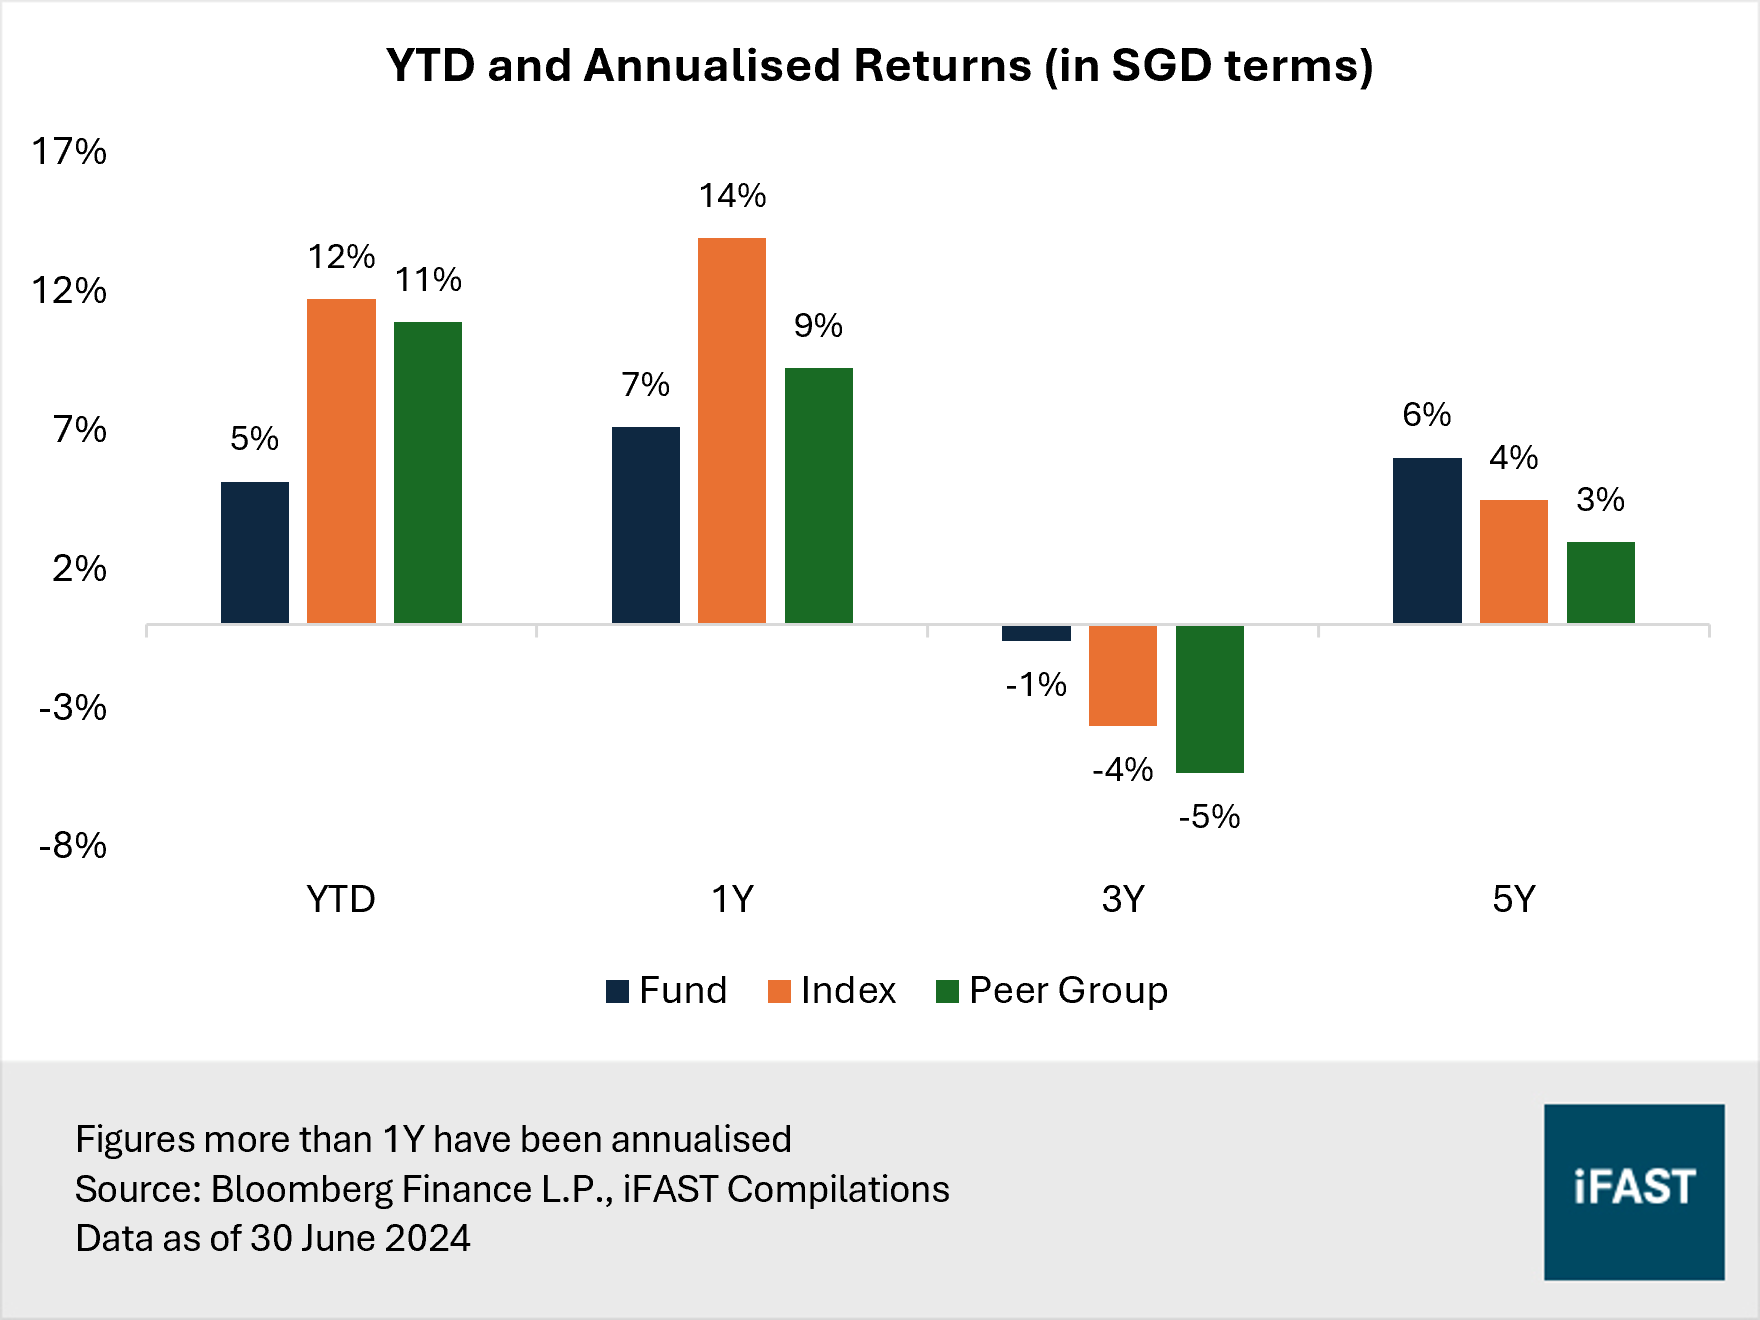
In the last five years, Fidelity Asia Pacific Dividend has posted annualised excess returns of around 2% over the MSCI AC Asia Pacific ex Japan Index (Figure 6). The fund also displayed stronger performance relative to its peers, returning annualised excess returns of 3% during this period.
Figure 5: The fund has a smaller drawdown, suggesting better risk management
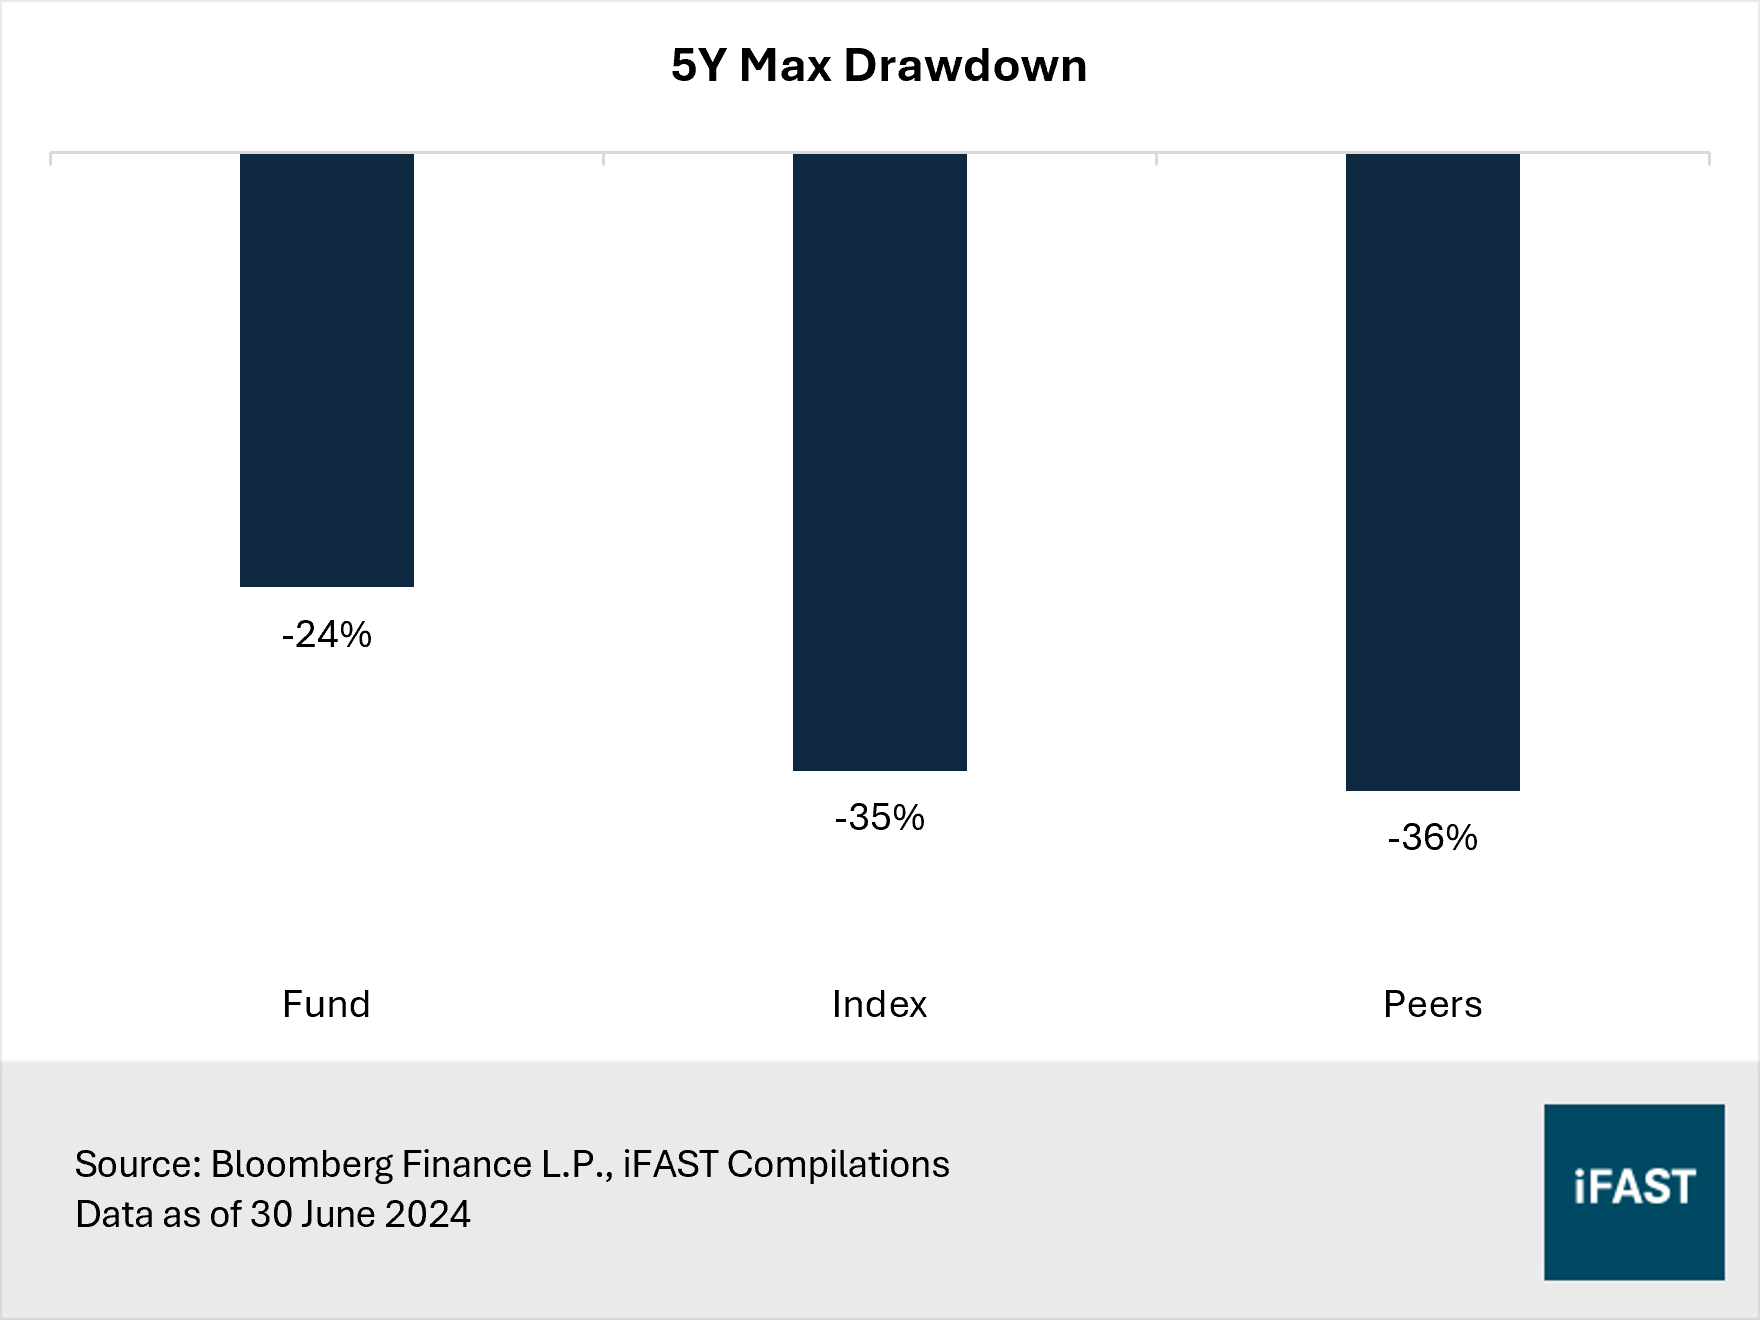
Figure 6: Solid long-term performance
Final thoughts
We like the Fidelity Asia Pacific Dividend Fund for its strategic focus on dividend-paying companies with sustainable business moats, high and stable cash flows, and strong balance sheets. This gives the fund a quality value tilt with defensive characteristics, translating into resilience during downturns and its ability to capture attractive upside when markets improve. Despite its underperformance year-to-date, we note that this pattern is typical during bull markets, and that its long-term track record is still solid. In our view, the fund is a splendid choice for investors seeking relatively stable returns from the Asian equity market.
All materials and contents found in this site are strictly for general circulation and informational purposes only and should not be considered as an offer, or solicitation, to deal in any of the funds or products found/identified in this site. While iFAST Financial Pte Ltd ("IFPL") has tried to provide accurate and timely information, there may be inadvertent delays, omissions, technical or factual inaccuracies and typographical errors. Any opinion or estimate contained in this report is made on a general basis and neither IFPL nor any of its servants or agents have given any consideration to nor have they or any of them made any investigation of the investment objective, financial situation or particular need of any user or reader, any specific person or group of persons. You should consider carefully if the products you are going to purchase are suitable for your investment objective, investment experience, risk tolerance and other personal circumstances. If you are uncertain about the suitability of the investment product, please seek advice from a financial adviser, before making a decision to purchase the investment product. Past performance is not indicative of future performance. The value of the investment products and the income from them may fall as well as rise. Opinions expressed herein are subject to change without notice. In respect of any matters arising from, or in connection with the said research analyses or research reports, recipients of the report are to contact IFPL at 10 Collyer Quay, #26-01 Ocean Financial Centre Building, Singapore 049315, or by telephone at +65 6557 2853. Where the report contains research analyses or research reports from a foreign research house and if the recipient of such research analyses or research reports is not an accredited investor, expert investor, institutional investor or an ex-accredited investor, IFPL accepts legal responsibility for the contents of such analyses or reports to such persons only to the extent as required by law. Please note that only certain security(ies) herein are available to all investors, while the rest are only available for certain persons to invest in, such as Accredited Investors (as defined in the Securities and Futures Act) or one who invests at least S$200,000 (or its equivalent currency) per transaction. To qualify as an Accredited Investor, one needs to submit a declaration form and certain relevant supporting documents, according to iFAST’s prevailing policies and procedures.
Please read our full disclaimers on the website at ( https://secure.fundsupermart.com/fsmone/policies/328125/investment-account-terms-&-conditions).
iFAST Financial Pte Ltd (IFPL) (registered address: 10 Collyer Quay #26-01 Ocean Financial Centre Singapore 049315, Telephone: 6557 2000) holds the Financial Advisers Licence issued by the Monetary Authority of Singapore ('MAS') to conduct regulated activities of advising on securities, marketing of collective investment schemes and arranging of any contract of insurance in respect of life policies, other than a contract of reinsurance and the Capital Markets Services Licence issued by the MAS to conduct regulated activities of dealing in securities and providing custodial services for securities. While IFPL has made every effort to ensure the independence of the report's contents, IFPL's nature of business is such that IFPL and its connected and associated entities together with their respective directors, officers and staff may be involved in providing dealing or investment-related services in the abovementioned securities, and have taken or may take positions in the securities mentioned in this report, and may also act as the principal for any buy or sell trades.