


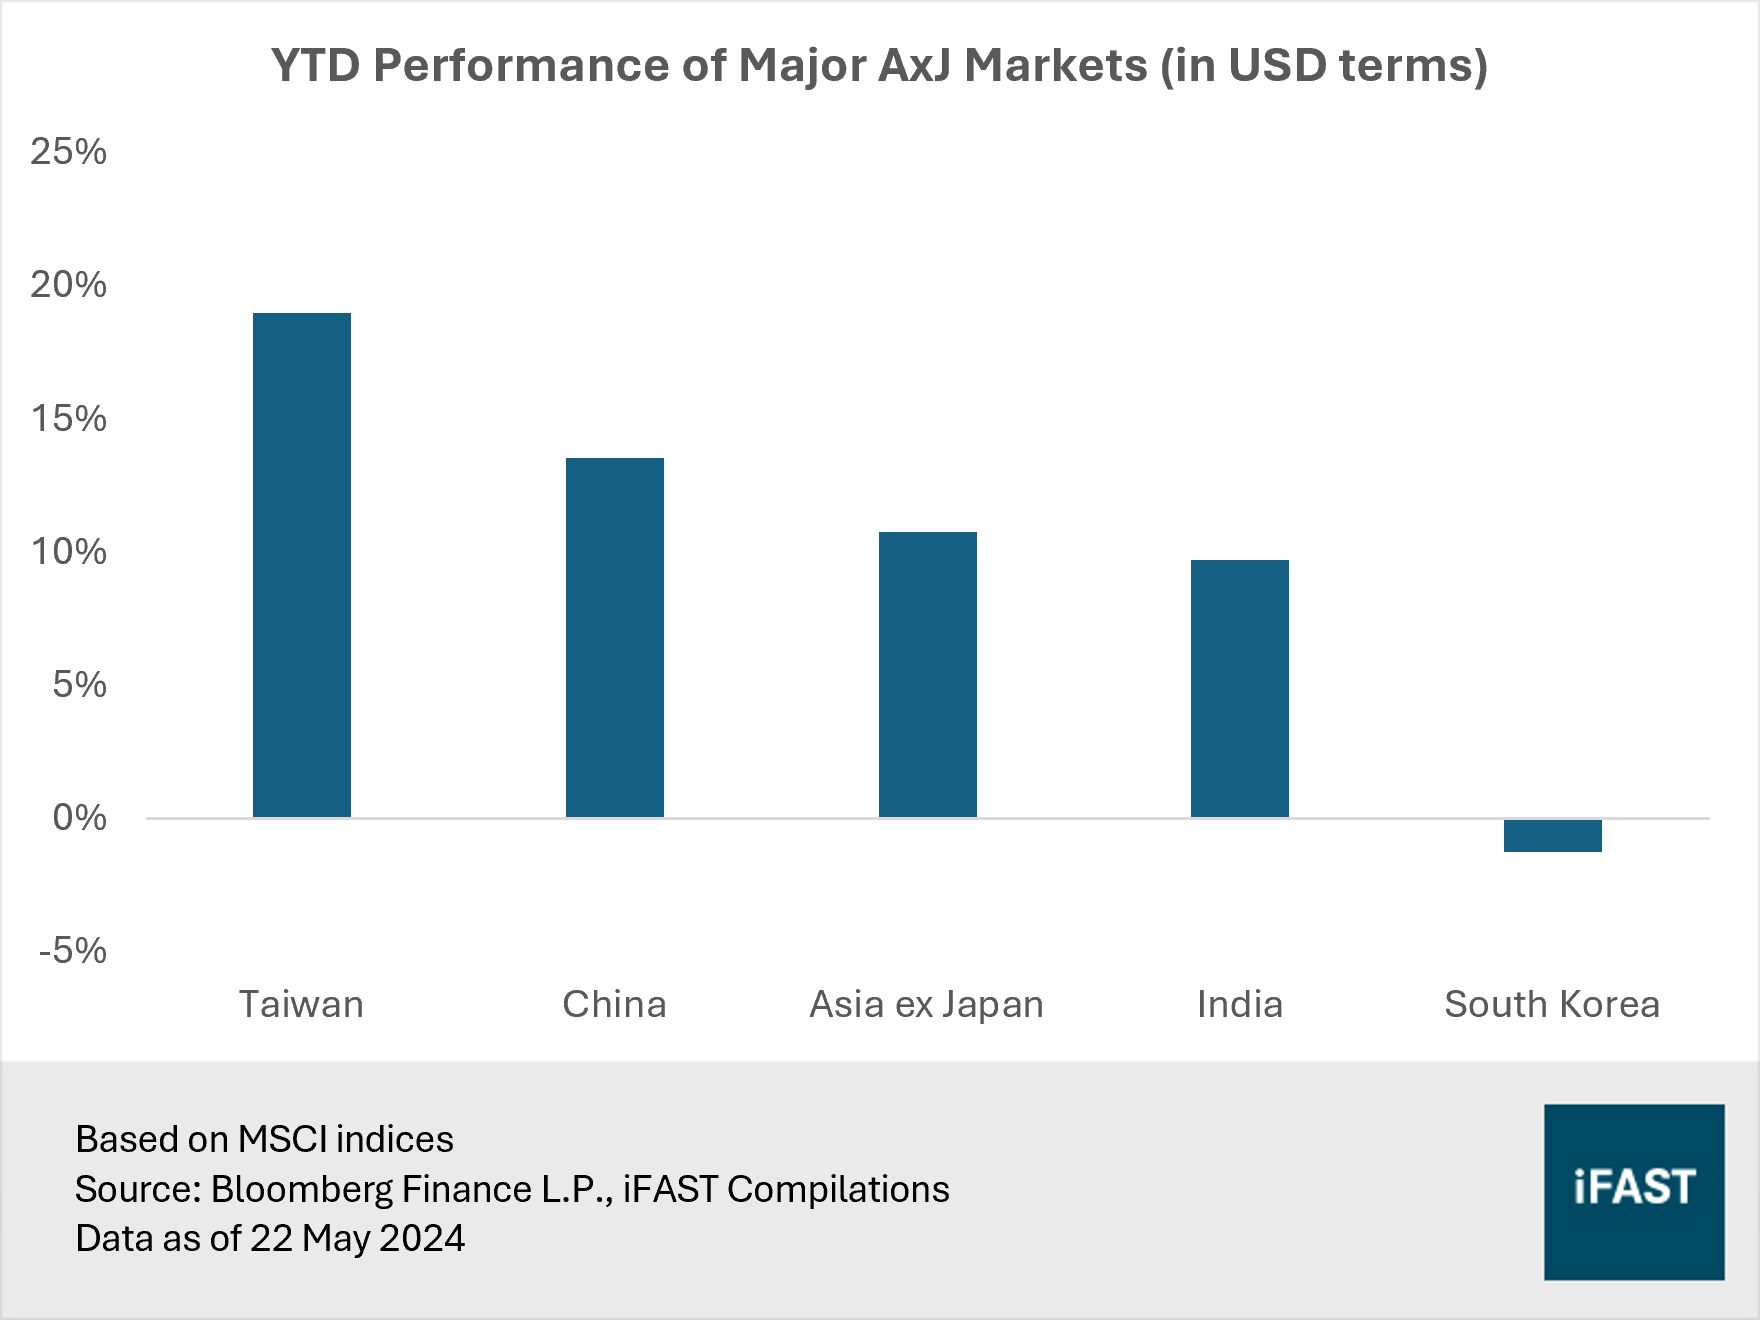
- Asian equities, as measured by the MSCI Asia ex Japan Index, have risen 10% year-to-date in USD terms, primarily fuelled by the rally in Chinese stocks.
- Despite optimism from China’s stronger-than-expected 1Q24 GDP data, our concerns linger about the sustainability of this growth.
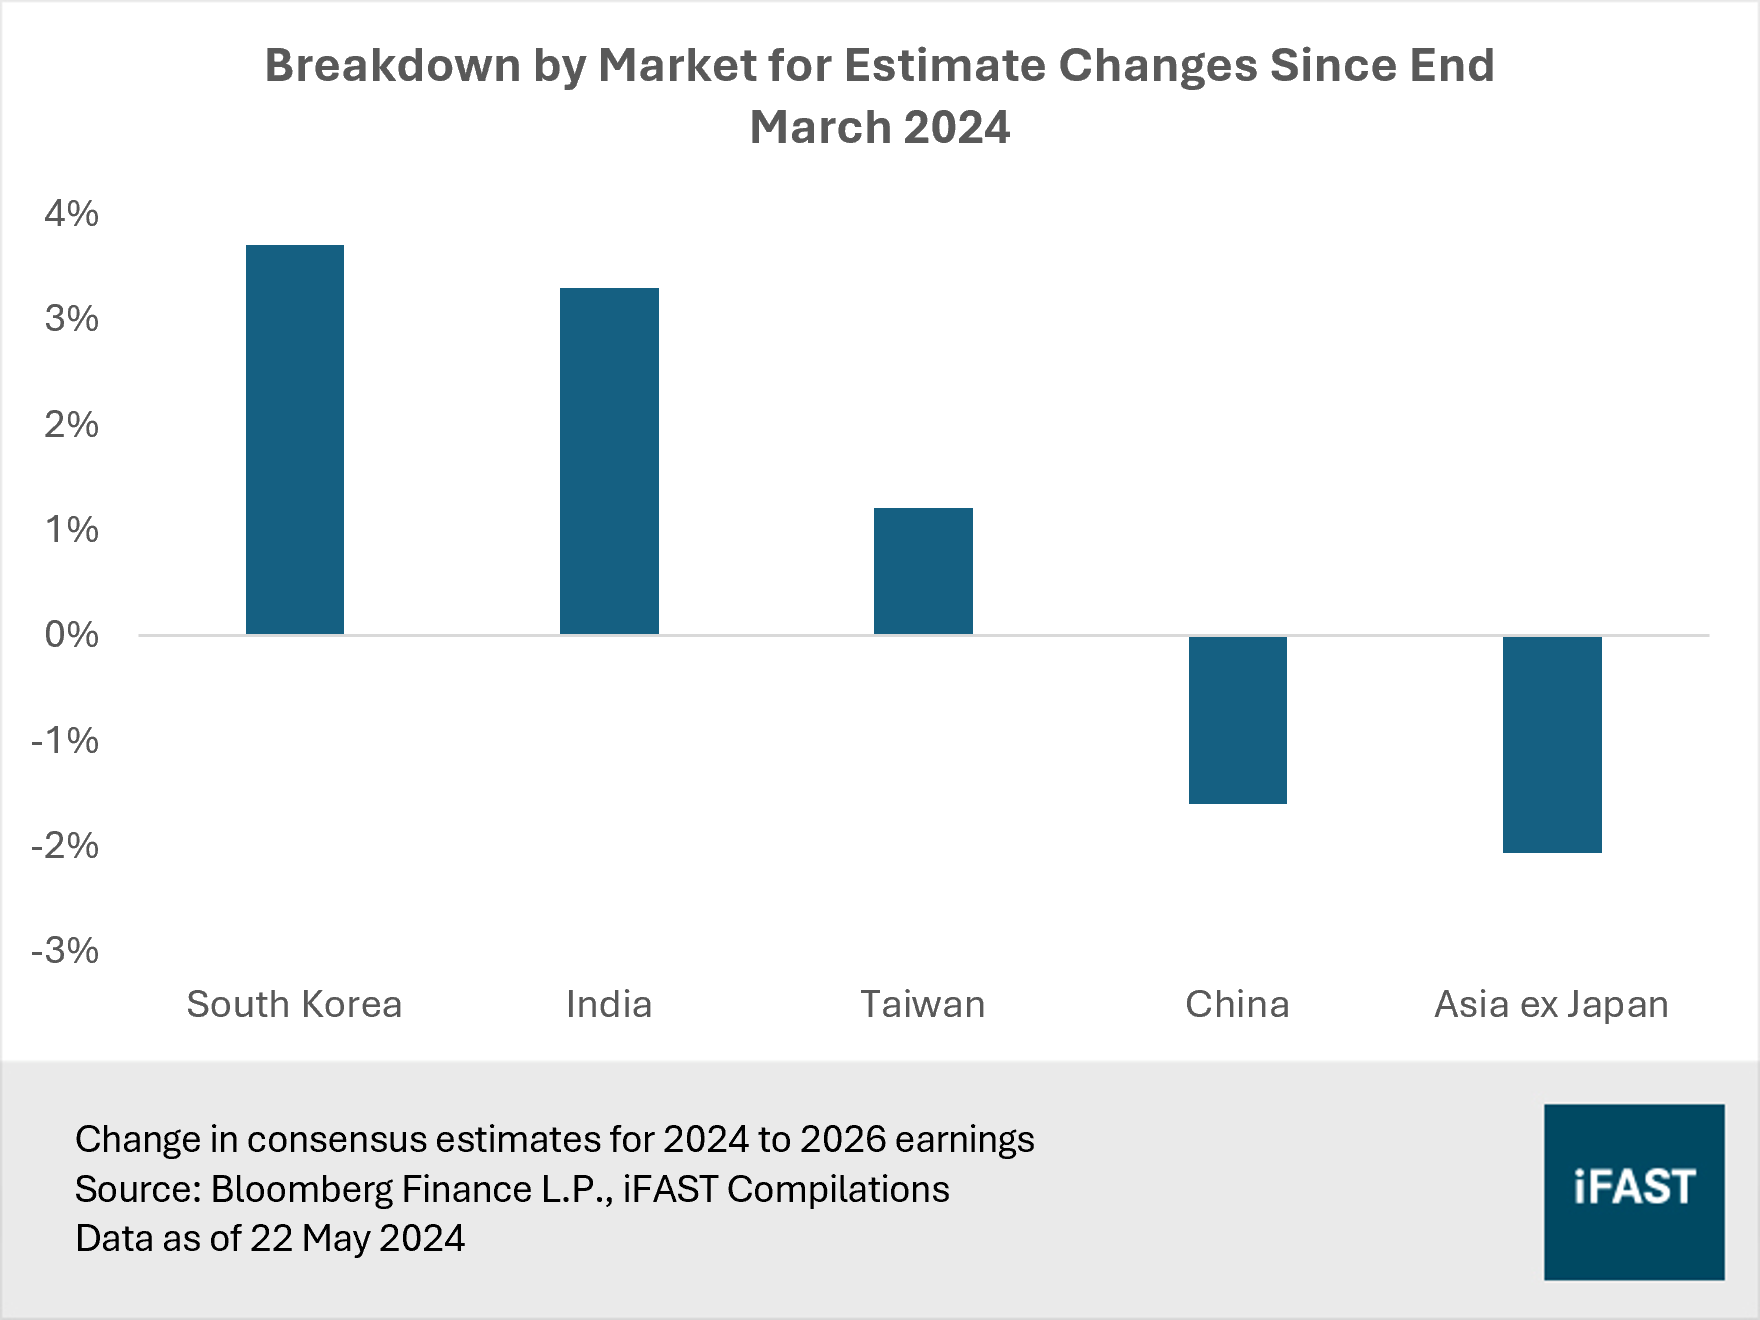
- We note that consensus estimates for Chinese equities have been revised downward since March, while other major Asian markets like South Korea, India, and Taiwan have seen earnings upgrades.
- While the opportunities appear promising as the world turns to India as an alternative to China, we highlight that India also faces significant challenges like a high unemployment rate and a chronic twin deficit.
- Based on our fair PE ratio of 13.5X, we project a 2026 target price of 770 for Asian equities, as represented by the MSCI AC Asia ex Japan Index, indicating a limited upside potential of around 10% as of 22 May 2024.
Asian equities, as gauged by the MSCI Asia ex Japan Index, are up 10% year to date (in USD terms; Figure 1). By and large, this can be attributed to the rally in Chinese stocks, spurred by investors eagerly returning to the market in response to stronger-than-expected economic indicators and heightened expectations of additional policy support.
Though, it is worth noting that China is not alone in driving the regional performance. Taiwan and India have also been key contributors. For instance, Taiwan rode on the global tech rally. Meanwhile, Indian equities have soared due to indications of a robust domestic economy.
Despite the encouraging performance of Asian equities, we maintain our neutral stance on this region. In this article, we explain the reasons behind our position.
Figure 1: China is the biggest contributor to returns
Our concerns regarding the sustainability of the China rally
China, which represents around 30% of the MSCI AC Asia ex Japan Index, remains a pivotal focus in the region. Despite the optimism generated by stronger-than-expected 1Q24 GDP data, which has increased the likelihood of China meeting its 5% growth target for the year, we have reservations about the sustainability of this growth.
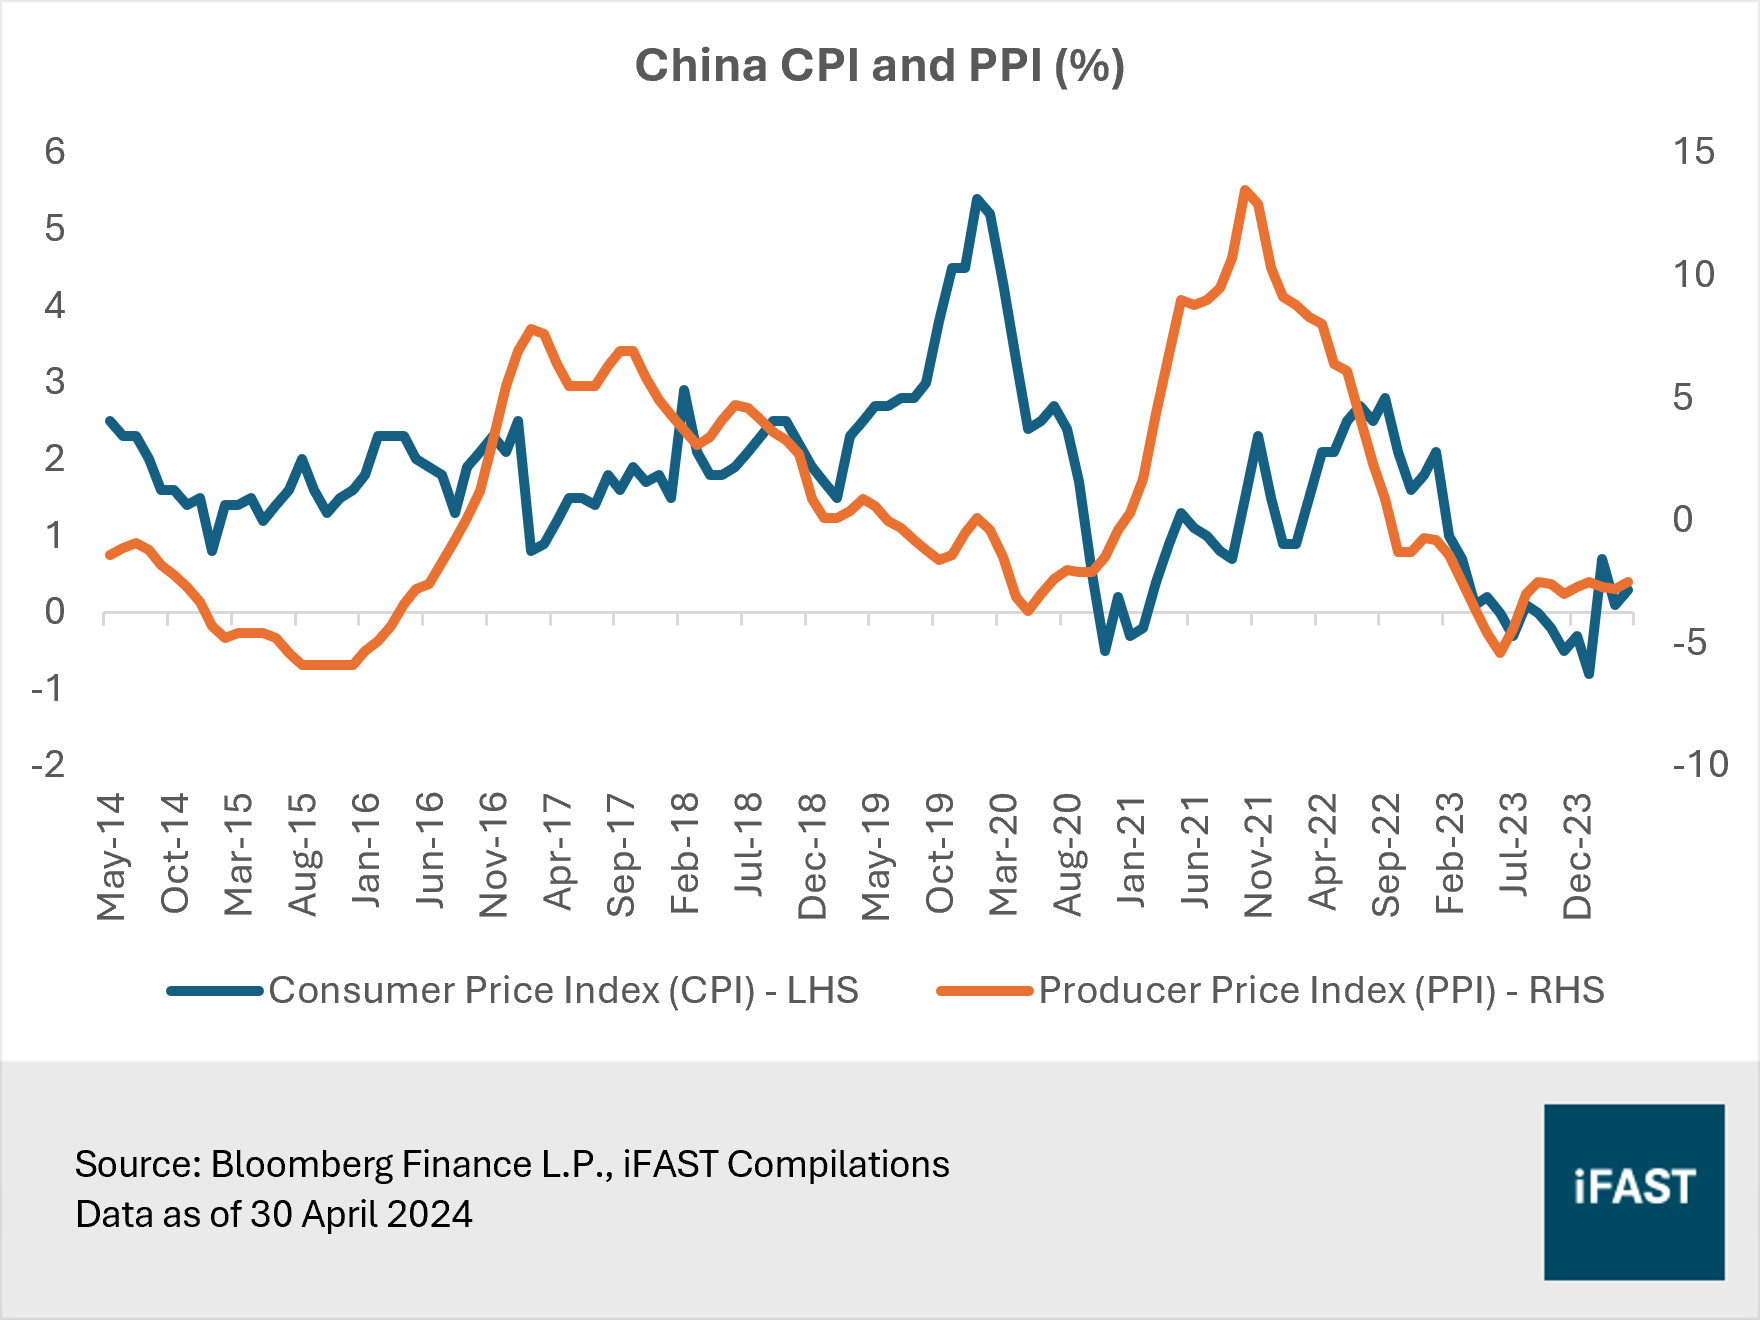
The consumer price index (CPI) in China edged up 0.3% year-on-year in April, a slight increase from the 0.1% rise in the previous month (Figure 2). While this represents the third straight month of rising consumer prices, it is important to note that China’s inflation remains well below the 2024 target of 3%. Simultaneously, the producer price index (PPI) shrank by 2.5% year-on-year, marking the 19th straight month of contraction. This underscores the challenges within China, casting doubt on the robustness of its economic recovery.
Figure 2: China struggles with deflation concerns
One of China’s
biggest challenges, which is the free-fall in the property market, continues to
weigh heavily on consumer and business confidence. Consequently, deflationary
pressures are a looming threat amidst weakening demand, posing a significant
risk to the economy.
Moreover, the renminbi (RMB) has come under pressure on the back of the fragile domestic economy as well as a stronger dollar. The currency has weakened to 7.2 against the dollar, a level that Chinese policymakers have been defending for months.
In our view, a weak RMB is unlikely to benefit China’s exports to a large extent as they are already garnering increased scrutiny from the West. The US and Europe have accused China of engaging in dumping practices by exporting cheap EVs, materials, and chemicals. Allowing the RMB to depreciate further could result in more scrutiny and trade restrictions. Therefore, China is likely to find its monetary policy constrained by not only interest rate differentials, but also pressure on its currency.
In sum, we find that the recent market rally was primarily driven by speculation and the fear of missing out on supposedly ‘cheap’ Chinese stocks, rather than by any substantial improvement in economic fundamentals.
This is additionally supported by China’s earnings outlook for 2024 to 2026. Consensus estimates have been revised downward by approximately -4% since the end of March. The persistence of these negative earnings revisions significantly heightens the risk to the sustainability of the market rally.
(Related article: Interpreting China's 5.3% GDP Growth in 1Q24: A Positive Sign?)
China weakness offset earnings strength in rest of the region
Excluding China, other major Asian markets like South Korea, India, and Taiwan have experienced positive outlooks, with earnings upgrade ranging between 1% and 4% since end-March (Figure 3). For example, South Korea’s solid earnings momentum has been lifted by the improving macroeconomic environment as well as positive earnings reports from chip giants.
Figure 3: China weakness has affected Asia’s earnings outlook
The country’s exports rose for a seventh straight month in April due to strong demand for chips while automobile sales and US shipments climbed to record highs. Rising chip demand, because of a tech rebound and AI tailwinds, is anticipated to drive an exports-led economic recovery in South Korea. Also, the country is preparing a support package worth more than KRW 10 trillion to boost investments and research in its critical semiconductor industry.
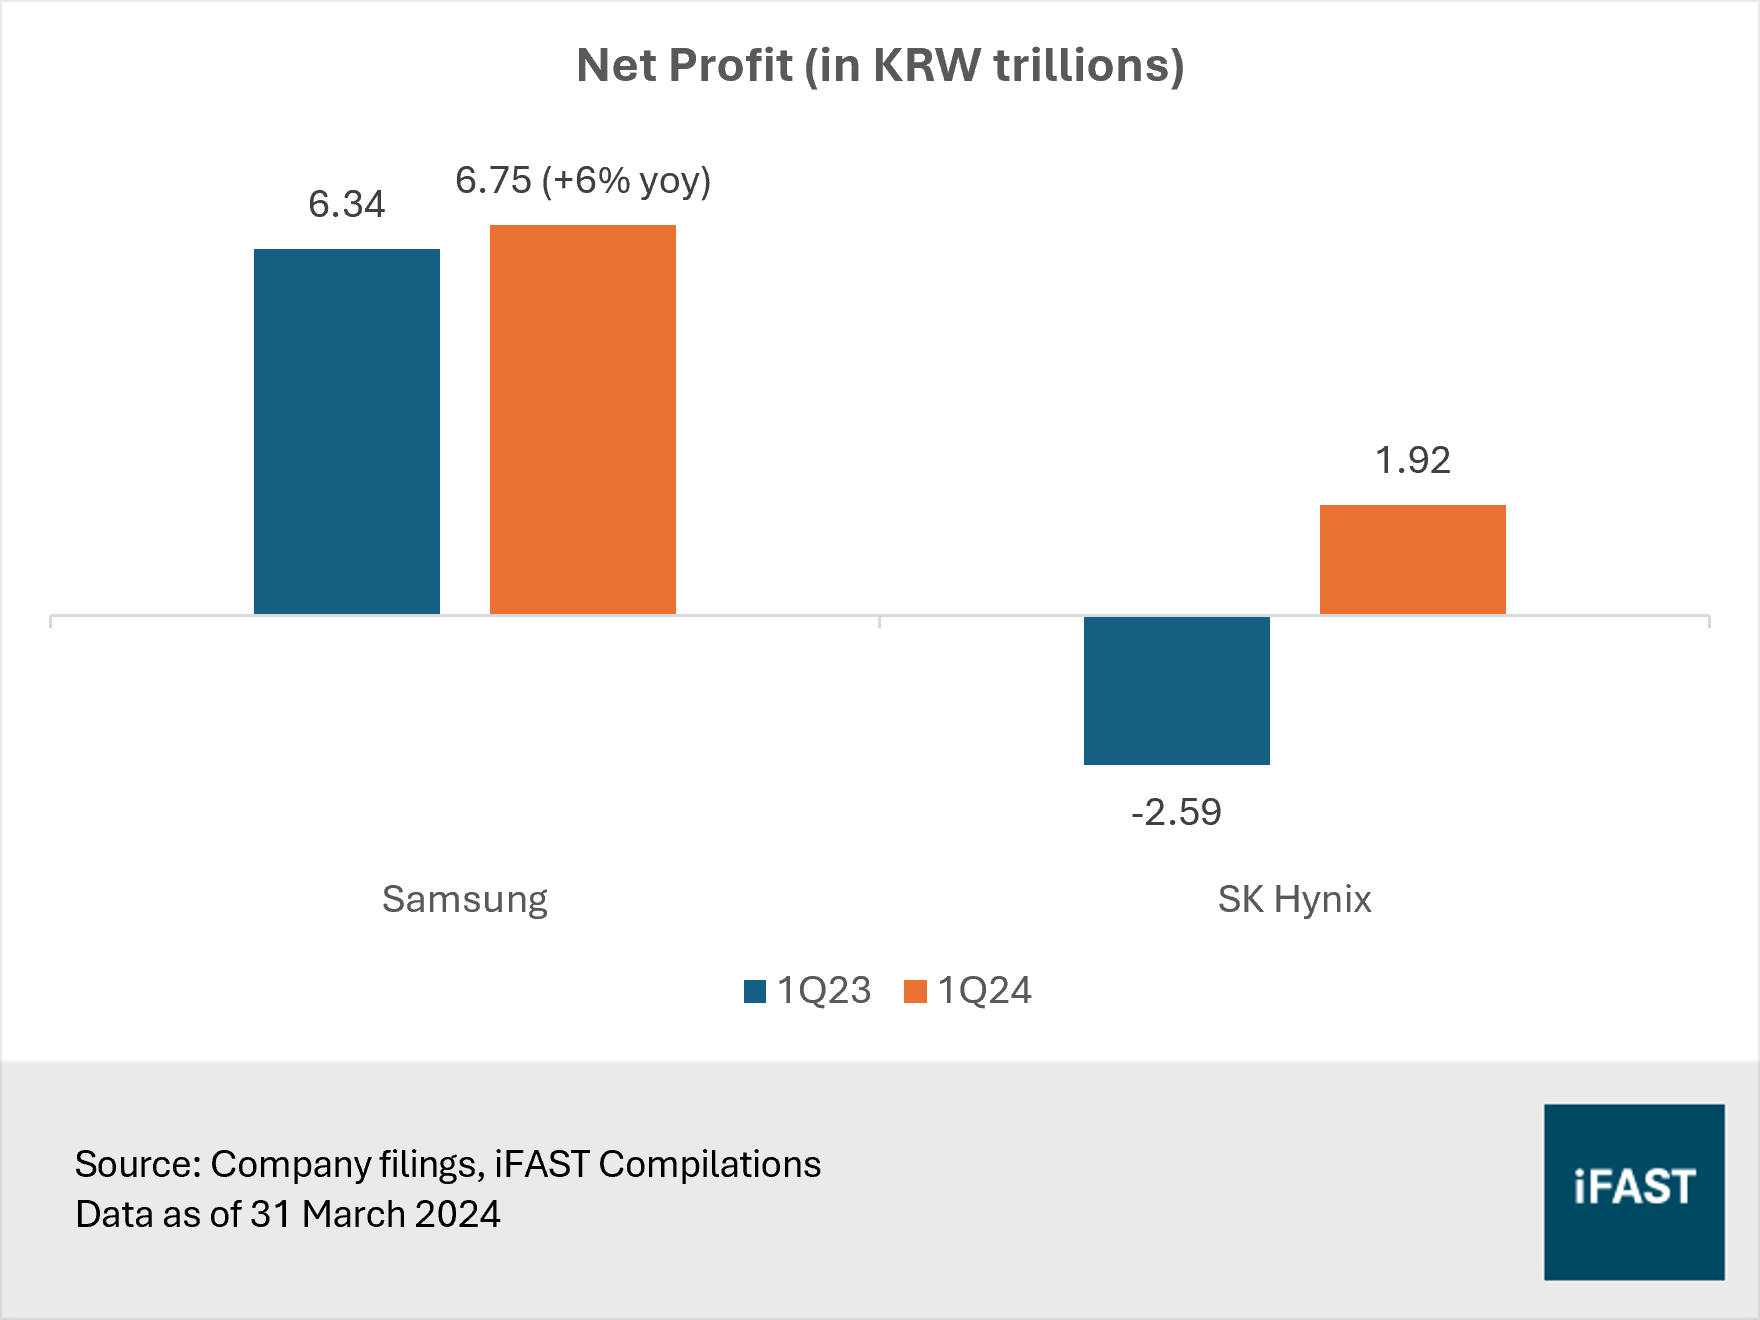
South Korea’s largest chipmakers, Samsung Electronics and SK Hynix, have posted profit surges in 1Q24 that exceeded analyst projections. SK Hynix delivered its highest profit in nearly two years, and expects a full recovery in the memory market thanks to the ongoing strength of AI demand (Figure 4). Similarly, Samsung’s topped earnings estimates after its semiconductor division returned to profitability. These results underscore the strength of South Korea's semiconductor industry.
Figure 4: South Korea’s chipmakers delivered strong results
Meanwhile, Taiwan’s outlook remains upbeat despite an unexpected rate hike from the central bank in the March policy meeting. 1Q24 GDP grew 6.51% year-on-year, the fastest pace in almost three years, as global demand for AI applications fuelled a boom in exports. Moreover, Taiwan’s exports continued their expansion in April, driven by the strength in the semiconductor sector.
India has also seen an upward revision of earnings owing to strong economic growth and rising optimism that Prime Minister Modi could be elected to a third term in June. Despite global headwinds, the Indian economy grew at an astounding 8.4% year-on-year from September to December 2023 from an increase in the government’s capital expenditure. Besides, Modi’s re-election is likely to pave way for added structural reforms to the economy, potentially boosting corporate earnings.
That being said, the positive earnings outlooks in South Korea, Taiwan, and India have failed to offset the weakness coming from China. On aggregate, Asian equities are suffering from negative earnings revisions, suggesting that the fragile Chinese economy continues to weigh heavily on the region.
India: A beneficiary of structural trends, but with its own set of challenges
At the same time, India – currently the second-largest economy in Asia – is emerging as a fast-growing alternative to China. Notably, it is increasingly viewed as a prime destination for diversifying supply chains away from China. The Indian government has been actively courting multinationals to establish operations in the country, rolling out a series of measures such as corporate tax cuts and incentives under the “Make In India” campaign.
Additionally, demographic growth in India has been promising. According to UN estimates, India surpassed China in 2023 to become the world’s most populous country. More than half of the population are under the age of 30, providing a strong labour supply. The strength of the middle class is also expanding, projected to reach 40% of the population by 2031, bringing with it rising purchasing power that will promote consumption.
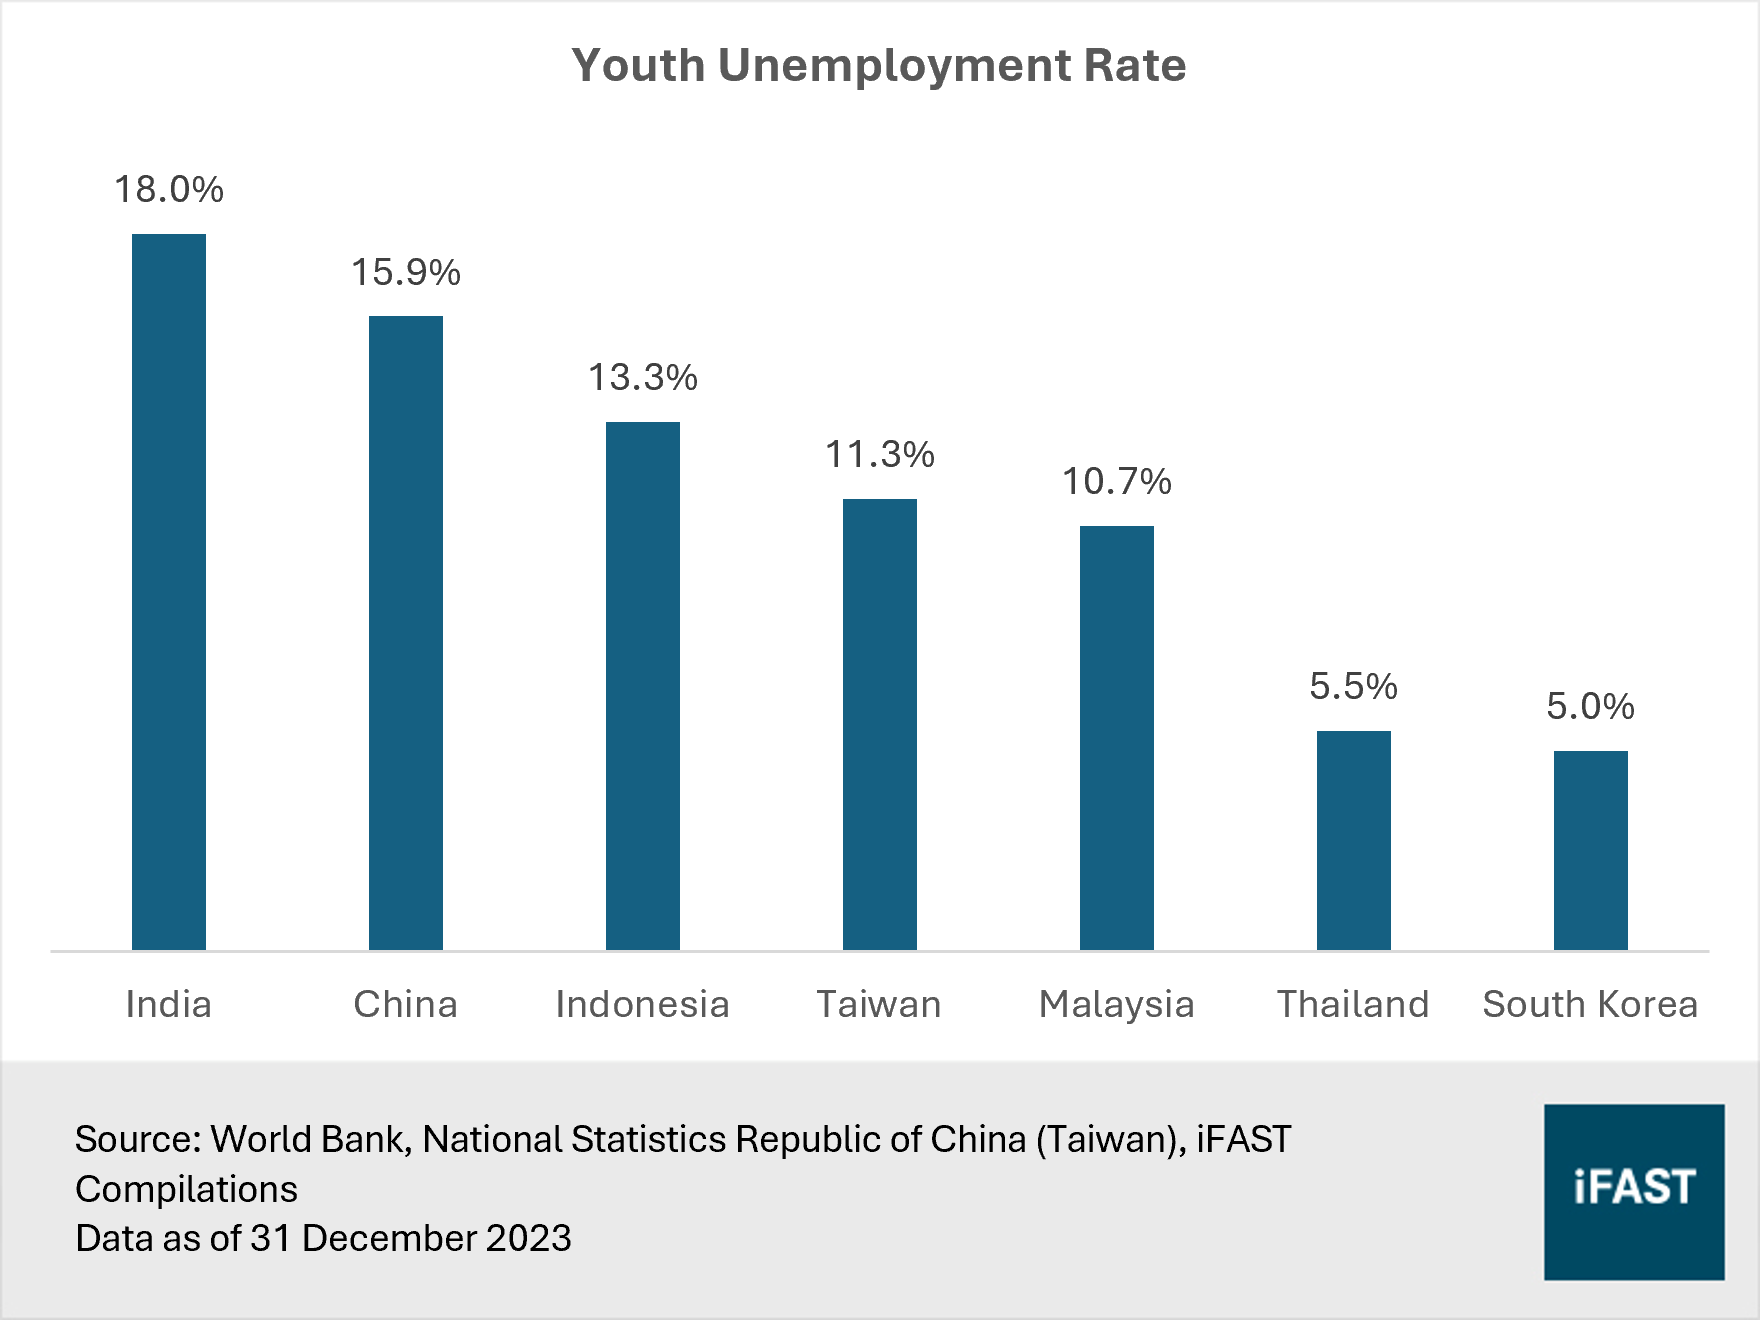
However, looking under the hood, despite the opportunities, India is grappling with a host of issues. The country’s youth unemployment is one of the most acute among its emerging market (EM) Asian peers like Thailand and Malaysia (Figure 5). More shockingly, according to estimates from World Bank, India’s youth unemployment rate is even higher compared to that of China.
This situation presents as a major economic challenge. Contributing factors include low labour force participation rates among women and the country’s inability to create jobs at a pace sufficient to absorb the growing number of job seekers. As such, after adjusting for population, India’s economic performance is not as impressive as it may seem: its GDP per capita ranks among the lowest in EM Asia.
Figure 5: Youth unemployment is acute in India
Moreover, the country is burdened by a twin deficit (i.e. fiscal deficit and current account deficit) which poses a substantial threat to long-term economic stability and growth. Coupled with the high youth unemployment rate, these issues highlight the importance for comprehensive reforms to fully capitalise on India's potential as an economic powerhouse.
Indian equities are currently trading at rich valuations compared to historical averages over the past decade. We believe that the upside potential is constrained by these elevated valuations. Furthermore, they present a risk of a market correction if future economic and earnings growth fail to meet expectations.
Be selective when investing in Asia
Given our cautious view on China and India – the two largest markets in the region, naturally, we do not find Asian equities as a whole particularly attractive.
Based on our fair PE ratio of 13.5X, we project a 2026 target price of 770 for Asian equities as represented by the MSCI AC Asia ex Japan Index. This translates into a limited upside potential of around 10% as of 22 May 2024. We maintain our rating of 2.5 Stars “Neutral” for the region.
Within Asia, we prefer selected markets like South Korea, Singapore, Taiwan, and Malaysia which we believe are poised to benefit from the global semiconductor sales rebound driven by strengthening demand from AI advancements.
Figure 6: Share price vs EPS
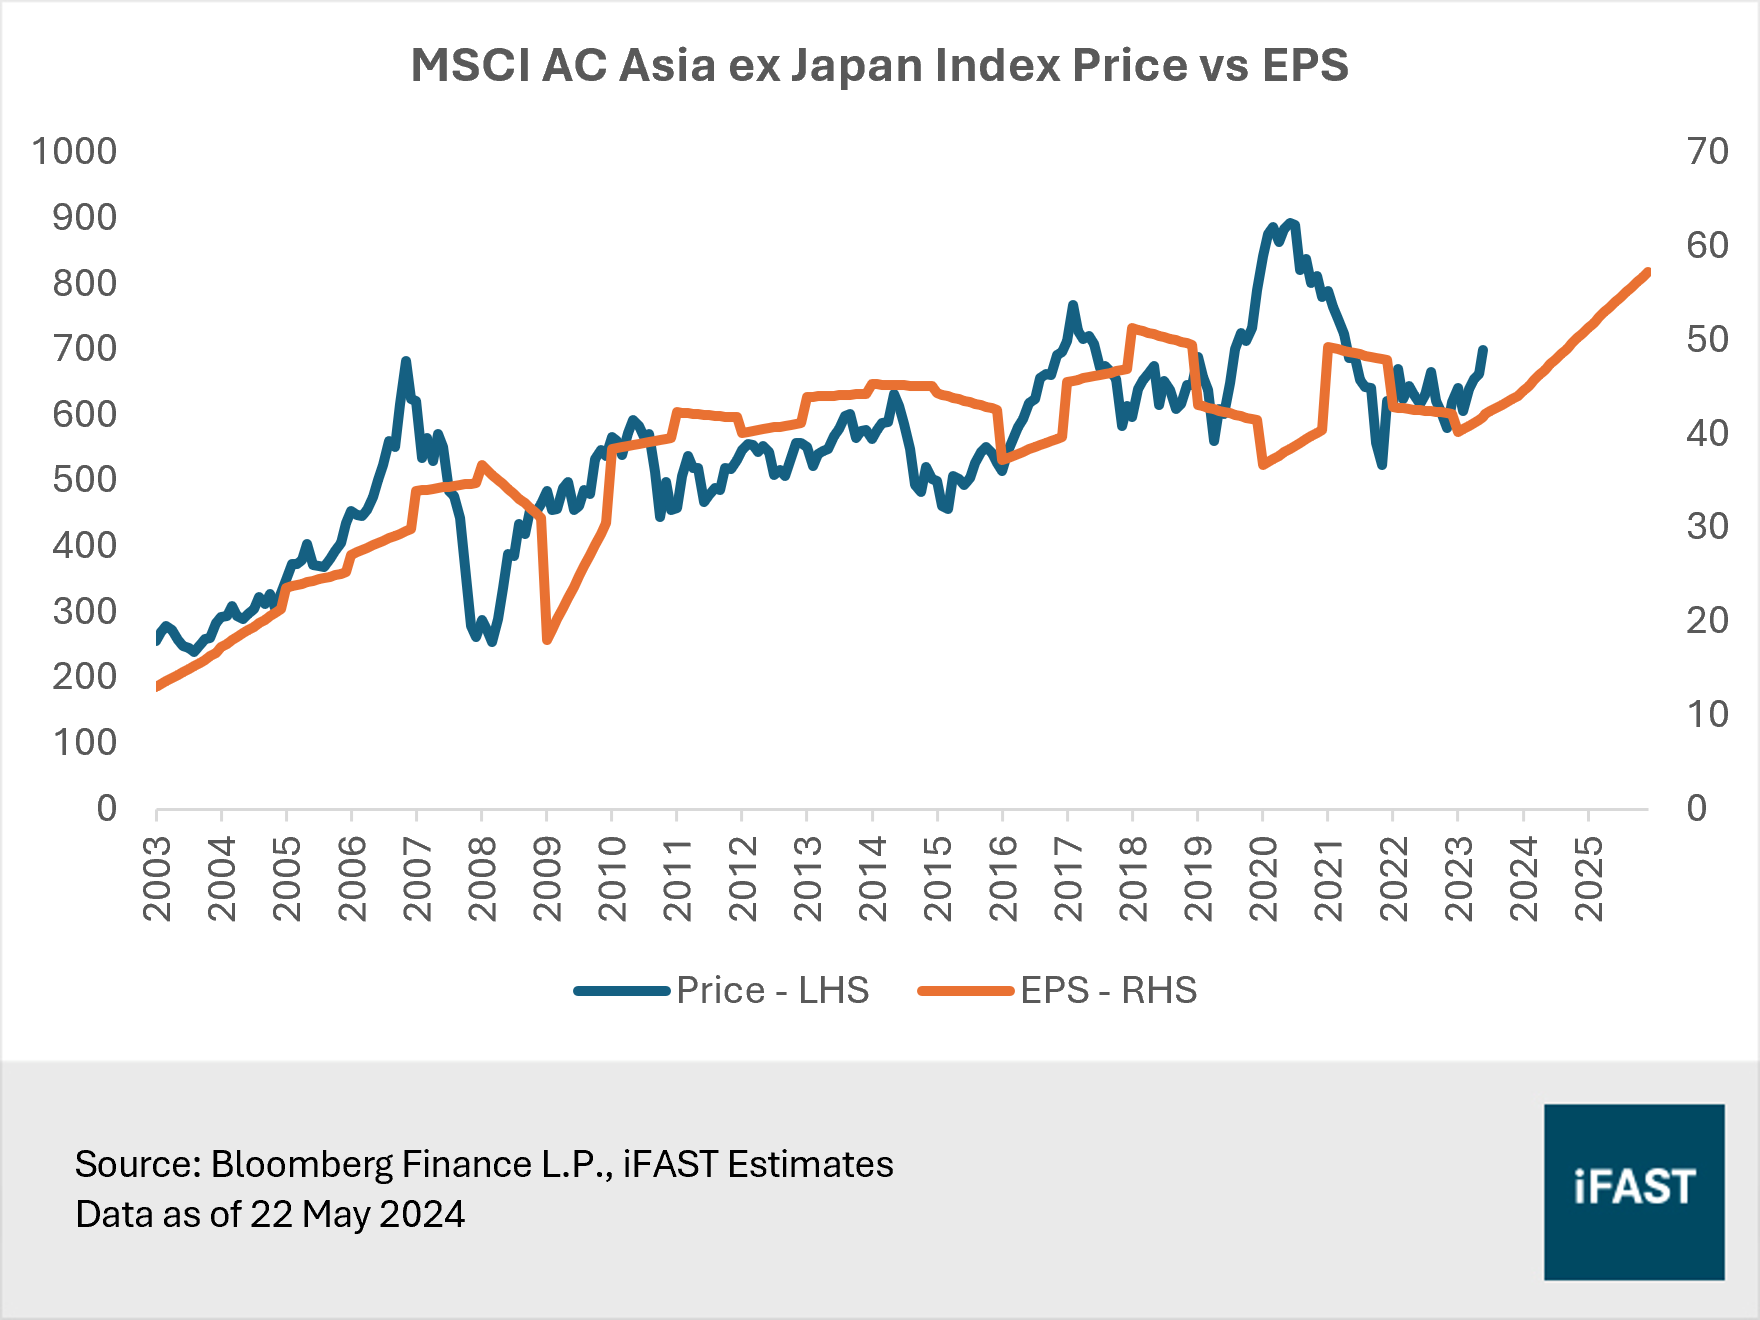
Table 1: Earnings projection
|
MSCI AC Asia ex Japan Index |
2023 |
2024E |
2025E |
2026E |
|
PE Ratio (X) |
15.9 |
15.9 |
13.8 |
12.2 |
|
Earnings Per Share |
40.24 |
44.02 |
50.80 |
57.30 |
|
Earnings Growth |
-10.4% |
9.4% |
15.4% |
12.8% |
|
Target Price (based on 13.5X fair PE ratio) |
770 |
|||
|
Upside Potential |
10% |
|||
|
Source: Bloomberg Finance L.P., iFAST Estimates Data as of 22 May 2024 |
||||
Table 2: Product recommendations
|
Market |
Unit Trust |
ETF |
|
Asia ex Japan |
||
|
South Korea |
||
|
Singapore |
||
|
Taiwan |
||
|
Malaysia |
Related articles:
Upgrade South Korea to 4 Stars: New Asian Tiger primed and ready for an export driven rebound
Singapore’s GDP to soar by 4% in 2024, here’s how to capitalise on this
Malaysia Outlook 2024: Transformative Odyssey
Declaration:
For specific disclosure, at the time of publication of this report, IFPL (via its connected and associated entities) and the analyst who produced this report hold a NIL position in the abovementioned securities.
All materials and contents found in this site are strictly for general circulation and informational purposes only and should not be considered as an offer, or solicitation, to deal in any of the funds or products found/identified in this site. While iFAST Financial Pte Ltd ("IFPL") has tried to provide accurate and timely information, there may be inadvertent delays, omissions, technical or factual inaccuracies and typographical errors. Any opinion or estimate contained in this report is made on a general basis and neither IFPL nor any of its servants or agents have given any consideration to nor have they or any of them made any investigation of the investment objective, financial situation or particular need of any user or reader, any specific person or group of persons. You should consider carefully if the products you are going to purchase are suitable for your investment objective, investment experience, risk tolerance and other personal circumstances. If you are uncertain about the suitability of the investment product, please seek advice from a financial adviser, before making a decision to purchase the investment product. Past performance is not indicative of future performance. The value of the investment products and the income from them may fall as well as rise. Opinions expressed herein are subject to change without notice. In respect of any matters arising from, or in connection with the said research analyses or research reports, recipients of the report are to contact IFPL at 10 Collyer Quay, #26-01 Ocean Financial Centre Building, Singapore 049315, or by telephone at +65 6557 2853. Where the report contains research analyses or research reports from a foreign research house and if the recipient of such research analyses or research reports is not an accredited investor, expert investor, institutional investor or an ex-accredited investor, IFPL accepts legal responsibility for the contents of such analyses or reports to such persons only to the extent as required by law. Please note that only certain security(ies) herein are available to all investors, while the rest are only available for certain persons to invest in, such as Accredited Investors (as defined in the Securities and Futures Act) or one who invests at least S$200,000 (or its equivalent currency) per transaction. To qualify as an Accredited Investor, one needs to submit a declaration form and certain relevant supporting documents, according to iFAST’s prevailing policies and procedures.
Please read our full disclaimers on the website at ( https://secure.fundsupermart.com/fsmone/policies/328125/investment-account-terms-&-conditions).
iFAST Financial Pte Ltd (IFPL) (registered address: 10 Collyer Quay #26-01 Ocean Financial Centre Singapore 049315, Telephone: 6557 2000) holds the Financial Advisers Licence issued by the Monetary Authority of Singapore ('MAS') to conduct regulated activities of advising on securities, marketing of collective investment schemes and arranging of any contract of insurance in respect of life policies, other than a contract of reinsurance and the Capital Markets Services Licence issued by the MAS to conduct regulated activities of dealing in securities and providing custodial services for securities. While IFPL has made every effort to ensure the independence of the report's contents, IFPL's nature of business is such that IFPL and its connected and associated entities together with their respective directors, officers and staff may be involved in providing dealing or investment-related services in the abovementioned securities, and have taken or may take positions in the securities mentioned in this report, and may also act as the principal for any buy or sell trades.