

- 2020 has been an eventful year. The Covid-19 pandemic has driven economies into deep recession, but the record levels of intervention by central banks and governments around the world were able to spur the economies to the shallowest of recoveries.
- The unique nature of the Covid-19 recession has created a stark difference between winners and losers. Investors have recognised Asia’s (i) relatively better Covid-19 management, (ii) support from China’s robust recovery and (iii) swift rebound in export, and their vote of confidence has reflected in the stellar performance of Asian equities this year.
- On the flip side, European equities have lagged the performance of US equities among western developed markets, partially due to its cyclical tilt and the higher sensitivity to poor economic conditions amid the Covid-19 pandemic.
- Across major markets, Asia ex Japan equities have led other regions in terms of performance on a year to date basis – registering a total return of +18.4% against MSCI World’s +14.5% (in USD terms).
- In spite of the pandemic, global equities performed surprisingly well at large. According to our FSM Indices – All Equities, which tracks the aggregate performance of all equity funds on our platforms, have delivered respectable returns of 14.0% year to date (as at 22-Dec-20).
- 2020 marks the end of the decade-long global economic cycle post 2008 GFC. Investors who have held on to their fund investments through the twists and turns of the cycle would have likely doubled their initial outlay (Chart 2).
- As we embark on the next cycle, can investors expect to achieve such stellar performance? We are inclined to believe so.
Chart 1: Performance of Global Equity markets in 2020

Chart 2: FSM Indices – All Equities have delivered respectable returns of 14.0% year to date.

Global Macro Outlook – Our stance for the global economy next year
- While economic uncertainties persist heading into 2021, we believe global economies around the world have begun their recovery process from the Covid-19 shock this year, albeit at differing pace. In the bigger picture, we have past the trough of the global economic cycle.
- The expansion witnessed in both global PMIs and positive surprises in economic data strongly reinforces the aforementioned view. We believe the recession will be over for most economies in 4Q 2020 - 1Q 2021. Given its lagging nature, upcoming GDP data should shed more light and confirm that we are past the trough.
- It is our belief that we are at an early economic expansion phase right now. This means a cyclical recovery is very likely to burgeon, uplifting global economic recovery and asset prices next year. Our eyes are also fixed at a potential wide approval of the vaccine, which will amplify the recovery in 2H 2020.
- We opine that global recovery may still be bumpy at the start of 2021 as Covid-19 still has its grip on western economies. Nonetheless, global recovery momentum should strengthen throughout 2021 and growth headwinds are likely to be dealt with further stimulus weaponry.
- All things considered, we are constructive on 2021’s macro outlook and expect above consensus year-on-year GDP growth of 5.8%. The vaccine-led macro recovery story in 2021 is bright as we round off 2020 and emerge from the valley of Covid-19.
Chart 3: Global economic growth projection for FY 2021

Global Equity Outlook – Where to find value and robust earnings?
- With valuations across equity markets now propped to heady levels, we argue that earnings and fundamentals will start to matter again once the global outlook regains clarity in 2021. We believe it pays to be more selective and FY21/22’s earnings will provide guidance into our search for value.
- In our opinion, equity markets which can deliver robust earnings rebound in FY21/22 should (i) minimize de-rating risks and ii) drive further equity returns. With the virus uncertainties and peak Covid-19 fears hopefully behind us, we increasingly expect investors to focus on corporate earnings.
- Rounding the bend into 2021, we favour Asia (particular China, Taiwan and South Korea) and Emerging markets (EMs) over developed markets like US and Europe.
- Cyclical Asian EM markets offers a good risk-reward profile, given that they have yet to catch up to global equities. Although Latin America and EMEA equities offers potentially higher upside, investor should note that they will be taking on a higher risk should they choose to invest in them as fundamentals of Latin America and EMEA equities are not as strong relative to Asian equities in the prevailing environment.
- Overall, our top five markets for 2021 are China, S. Korea, Taiwan, Indonesia, Brazil.
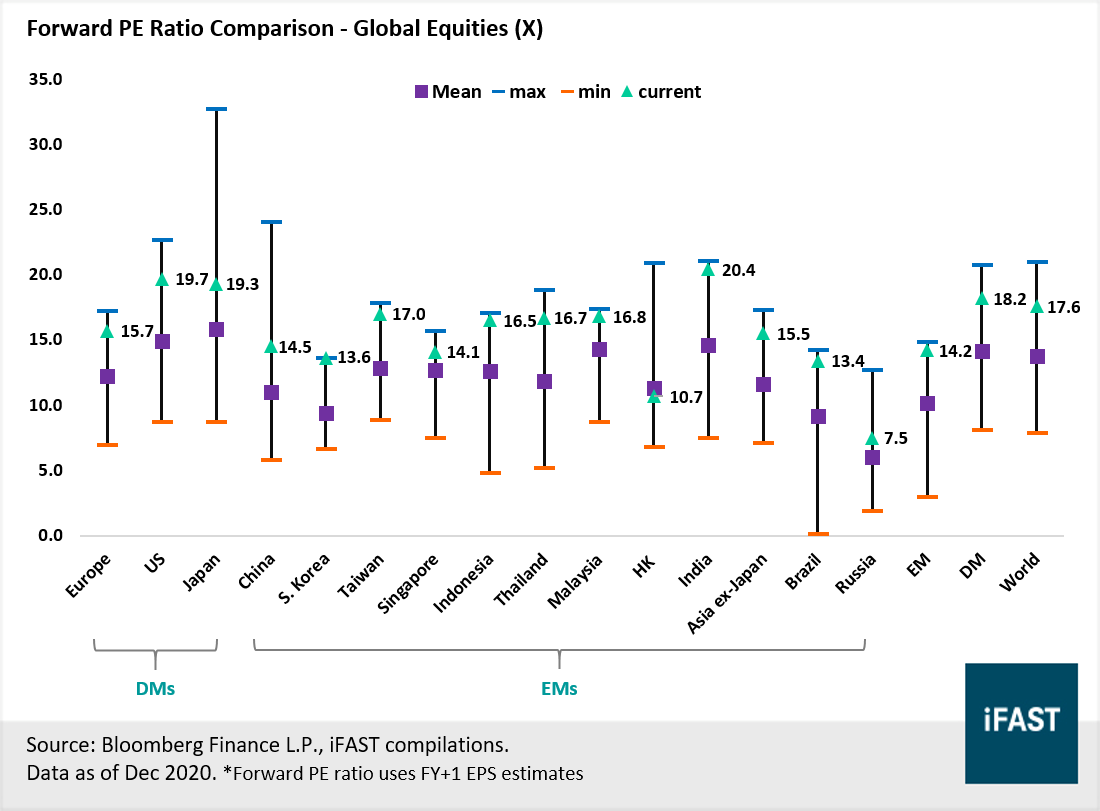
Chart 4: Forward Valuations of Global Equities are trading near the top of their long-term ranges
Global fixed income outlook - Where to find yields?
- Faced with a ‘lower for longer’ policy rates outlook, the attractiveness of fixed income as an income-generating tool has diminished. Nevertheless, opportunities still exists within the high yield segment which may offer investors spread compression gains and a beefy yield pickup (vs investment grade).
- Three fundamental dynamics will bolster demand for the high yield sub segment – (i) the aggressive search for as depressed rates stick around, (ii) rising risk appetite buttressed by a positive recovery story, and (iii) improving economic and credit fundamentals for corporates/ sovereigns.
- Across fixed income sub segments, we find value in Asia high yield and EM high yield whereby spreads are still above or at least in align with mean. These sub segments are also offering a yield pickup of 600 – 350 bps against the investment grades.
Chart 5: Credit spreads across bond segments have compressed significantly across 2020

Global Sectors Outlook – Covid-19 driven digitalisation
- The Covid-19 pandemic has inadvertently accelerated the global economies’ transformation into an increasingly digitalised one. As businesses, consumers and households began to adapt to conducting day-to-day affairs in the online world, we believe that the paradigm shift towards a digital economy is nigh irrevocable.
- Consumption trends like 5G upgrade cycle, rising e-commerce penetration and online media consumption will continue to drive robust double-digit earnings growth for global technology giants like Apple, Amazon, Alibaba and Tencent.
- For healthcare sector, the Covid-19 pandemic have emphasized the need for greater healthcare innovations. We expect governments and businesses around the world to spend more money purchasing Covid-19 test kits, personal protection equipment (i.e. masks and hazmat suits), sanitation solutions and vaccine shots, which bode well for earnings growth in the healthcare sector.
- On the other hand, the beaten down sectors like Financials, Industrials and Consumer Discretionary could see a massive jump in revenue and earnings in the next two years, on the basis of global recovery in 2021.
- Financials is a key sector we think is worth investing during the early stages of a new economic cycle – high double-digit growth are typical for banking industry post-recession. At the same time, regulators across the globe has taken several actions earlier this year to ensure that banks conserve sufficient cash to weather through the pandemic downturn.
Table 1: Upside Potential and Star Ratings across Equity Markets 2021
|
Markets & Sectors |
Upside Potential by End-22 |
2021 Star Ratings (Scale 0f 1 - 5) |
Rating |
|
World |
14% |
- |
- |
|
Developed Markets |
16% |
- |
- |
|
China |
22% |
4.5 |
Very Attractive |
|
Hong Kong |
33% |
4.5 |
Very Attractive |
|
Emerging Markets |
20% |
4.0 |
Very Attractive |
|
Asia Ex Japan |
22% |
4.0 |
Very Attractive |
|
S. Korea |
22% |
4.0 |
Very Attractive |
|
Taiwan |
17% |
3.5 |
Attractive |
|
Indonesia |
17% |
3.5 |
Attractive |
|
Russia |
19% |
3.5 |
Attractive |
|
Brazil |
26% |
3.5 |
Attractive |
|
US |
19% |
3.0 |
Attractive |
|
Europe |
23% |
3.0 |
Attractive |
|
Japan |
19% |
3.0 |
Attractive |
|
Singapore |
14% |
3.5 |
Attractive |
|
India |
16% |
2.5 |
Neutral |
|
Thailand |
7% |
2.5 |
Neutral |
|
Malaysia |
2% |
2.5 |
Neutral |
|
Digital Economy |
-3.5% |
2.5 |
Neutral |
|
Source: iFAST estimates. As of 23-Dec-2020. |
|||
Table 2: Our views on Key Sectors ahead
|
Markets & Sectors |
Upside Potential by End-22 |
2021 Star Ratings (Scale 0f 1 - 5) |
Rating |
|
Global Financials |
24% |
3.5 |
Attractive |
|
Global HealthCare |
10% |
3.0 |
Attractive |
|
US Semiconductors |
13% |
3.0 |
Attractive |
|
Source: iFAST estimates. As of 23-Dec-2020. |
|||
China 2021 Outlook – 4.5 Stars “Very Attractive”
- China’s economy is recovering ahead of the globe and is set to retain its lead in 2021, driven by the impact of the stimulus measures launched this year. One of the key drivers for the recovery is China's strong industrial and export sectors. For the bulk of 2020, China’s exports was driven by overwhelming demand for Covid-related medical products. Moving into next year, we expect that to shift towards goods-related to cyclical sectors, as the global recovery continues to build.
- Although Biden's foreign trade policies are likely different from Trump's, we expect trade frictions to persist. However, we believe Biden is unlikely to i) adopt Trump's aggressive approach of utilizing tariffs and ii) retaliate erratically. This backdrop spells positive for China’s export and industrial sectors, which will be supportive of growth in 2021.
- For equities, corporate earnings growth rate is on track for a rapid rebound in the next two years – FY21 (+25.3% YoY) and FY22 (+23.0% YoY). As part of the ‘Dual Circulation’ strategy implemented in May this year, we believe the near-term focus will be to spur “Internal Circulation” within the Chinese economy – stimulating consumption nationwide, while simultaneously developing critical technologies such as semiconductors and 5G telecommunications.
- We expect the theme of ‘Consumption Upgrade’ and ‘Technology’ to serve as the twin engines for the long-term growth momentum for China’s economy. Sectors (i.e. Technology and Consumer Discretionary) providing exposure to these long-term growth themes in China are slated to ride on the huge policy tailwinds for further expansion ahead. A broad global economic recovery should also support cyclical sectors like Financials and Industrials where valuations are still cheap relative to growth sectors.
- While valuations are stretched on a historical basis, we believe that the premium is warranted due to the stronger economic fundamentals and structural upgrade via rising inclusion of Technology stocks within the Chinese equity Index. As a result, we have adjusted our fair PE ratio for China equities up to 14.5X (from the previous 13.5X). Global investors’ still-light positioning in Chinese equities and reasonable valuations compared to global peers could encourage further inflows to the market.
- We maintain our view that the RMB has further upside potential and expect it to appreciate by 3-5% against the USD in 2021. Our targeted exchange rate is approximately 6.3 CNY/USD. The RMB’s strength will be driven by a widening interest rate spread, and China’s rosy macro recovery story. For foreign investors, the appreciating RMB against their home currencies will be a positive as well.
- Peering ahead, our team’s forecast for China’s real GDP growth for 2021 is +8.5% – highest among major economies. Such robust growth prospects is stacked on top of over 2% growth this year, while the rest of the world contracted due to Covid-19. Based on our calculations, our bold prediction is that China's GDP will surpass the United States in 2026 – potentially taking over the mantle as the world’s largest economy within the next 5 years.
- With the performance of Chinese equity markets exhibiting a high positive correlation with its GDP growth, we expect China's equities to generate substantial returns for our investors in the years ahead – even with its stellar performance of +28% this year.
- Applying the fair PE of 14.5X on our FY22 estimated EPS, we derived a target price of 131 for MSCI China Index by end-2022. This represents an upside potential of +22% from yesterday’s (22 December) closing price.
- As investors ourselves, we believe that the investing is most profitable when one looks further in the horizon. Coupled with our optimistic outlook for China in the year ahead, especially as economic conditions are on firmer footing than the rest of the world, we maintain our favorable view on China equities at 4.5 Stars “Very Attractive” ratings for 2021.
Recommended products for exposure to China
|
Category |
Products |
|
Actively Managed Fund |
|
|
Passive Tracking ETF |
Table 3: Upside Potential of China equities by end-2022
|
MSCI China Index |
FY2019 |
FY2020 |
FY2021 |
FY2022 |
|
PE ratio (X) |
17.0 |
18.3 |
14.6 |
11.9 |
|
Expected earnings growth (YoY %) |
0.2% |
-6.90% |
25.3% |
23.0% |
|
Earnings Per Share (EPS) |
6.28 |
5.85 |
7.33 |
9.01 |
|
Projected fair price (Based on 14.5X Fair PE ratio) |
- |
- |
- |
131 |
|
Potential upside (%) |
- |
- |
- |
22% |
|
Source: Bloomberg Finance L.P., iFAST estimates. Data as of Dec 2020. |
||||
Chart 6: Prices of Chinese equities against its earnings growth projections

Chart 7: Performance of Chinese funds on iFAST platforms over the last ten years

Asia ex-Japan 2021 Outlook – 4.0 Stars “Very Attractive”
- Asia ex-Japan is entering 2021 with strong growth momentum. Growth in the region will likely outpace western peers due to the i) pick up in global industrial and tech cycle, fuelling Asia exports, and ii) strong domestic demand recovery.
- Asia ex-Japan equities are supported by a cocktail of tailwinds entering 2021, such as the stronger economic momentum, better Covid-19 situation, a Biden administration and robust earnings growth. Compounded with mounting risks appetite for Asian equities, these tailwinds may drive its outperformance in the near-term.
- Earnings growth in the next two years stands out relative to regional peers. The decline in this year will be shallow at 7% YoY and rebound steadily in FY21 (27% YoY) and FY22 (18% YoY). We expect earnings to recover to pre-Covid level in 3Q/4Q 2021, 1 – 2 quarters ahead of peers.
- Despite the recent run-up, we expect Asia ex-Japan equities (gauged by MSCI Asia ex-Japan index), to deliver a potential upside of 22% by end-2022. With a volley of tailwinds and attractive upside, it offers one of the most favourable risk-reward profile. We assign a star ratings of 4.0 stars “Very Attractive”.
- Within Asia ex-Japan, North Asia equities possesses stronger earnings and economic growth outlook for 2021. We expect markets such as Taiwan and S. Korea to also be uplifted by the tech cycle. While virus and growth headwinds still challenge much of Southeast Asian markets and India, we favour Indonesia for its ‘catch-up’ potential.
Recommended products for exposure to Asia ex-Japan
|
Category |
Products |
|
Actively Managed Fund (s) |
|
|
Passive Tracking ETF |
Table 4: Upside Potential of Asia ex-Japan equities by end-2022
|
Asia ex Japan (MSCI Asia ex japan Index) |
FY2019 |
FY2020 |
FY2021 |
FY2022 |
|
PE Ratio (X) |
16.6 |
19.7 |
15.5 |
13.2 |
|
Expected Earnings Growth (YoY %) |
-10.6% |
-6.8% |
27.0% |
18.0% |
|
Earnings Per Share (EPS) |
44.7 |
41.6 |
52.8 |
62.3 |
|
Potential Upside from Today (%) |
- |
- |
- |
22% |
|
Source: Bloomberg Finance L.P., iFAST estimates. Data as of Dec 2020. |
||||
Chart 8: Prices of Asia ex Japan equities against its earnings growth projections

Chart 9: Performance of Asia ex-Japan funds on iFAST platforms over the last ten years.

Emerging Markets 2021 Outlook – 4.0 Stars “Very Attractive”
- Overall macro picture of EMs have improved vastly in recent months. As we enter 2021, the combination of i) cyclical recovery, ii) weakening USD, iii) commodity upcycle and iv) China’s strong recovery should uplift EM’s growth. A vaccine approval will also be a huge catalyst.
- Looking ahead, EM equities may see strong performance underpinned by major tailwinds – prolong US dollar weakness and commodity upcycle. These are likely long-term tailwinds, providing a multi-year positive set up for EM equities.
- Uplifted by a global cyclical recovery, we expect robust earnings growth in FY21 (37% YoY) and FY22 (22% YoY), as suggested by leading indicators such as China’s monetary stimulus and commodity prices. We find consensus’ earnings estimates too conservative and see upwards revisions next year, providing the impetus for greater price return from reaction to earnings revisions.
- EM equities (gauged by MSCI EM index), in aggregate, are set to deliver a potential upside of 19% by end-2022. We believe a heady cocktail of positive catalysts are aligning for the EMs and the tide is turning, we assign a star ratings of 4.0 stars “Very Attractive” to EM equities.
- Asia EM equities should lead outperformance early in FY21. It offers a better risk-reward profile, especially for cyclical Asian EMs. LATAM and EMEA equities, having yet caught up, may offer greater upside potential in FY21 but at the cost of higher risks embedded. Our EM top picks - China, S. Korea, Taiwan, Indonesia, Brazil.
Recommended products for exposure to EMs
|
Markets |
Actively Managed Funds |
ETF |
|
Emerging Market |
||
|
China |
||
|
S. Korea |
||
|
Taiwan |
||
|
Indonesia |
||
|
Brazil |
Table 5: Upside Potential of EM equities by end-2022
| Emerging Markets (MSCI EM Index) | FY2019 | FY2020 | FY2021 | FY2022 |
| PE Ratio (X) | 15.3 | 19.4 | 14.2 | 11.6 |
| Expected Earnings Growth (YoY %) | -13.00% | -15.50% | 36.50% | 22.00% |
| Earnings Per Share (EPS) | 72.8 | 64.9 | 88.6 | 108.1 |
| Projected Fair Price (Based on 14.0X Fair PE Ratio) | - | - | 1240.4 | 1513.4 |
| Potential Upside from Today (%) | - | - | - | 20% |
| Source: Bloomberg Finance L.P., iFAST estimates. Data as of Dec 2020. | ||||
Chart 10: Prices of EM equities against its earnings growth projections

Chart 11: Performance of EM funds on iFAST platforms over the last ten years

US 2021 Outlook – 3.0 Stars “Attractive”
- In the near-term, we expect US equities to face slight resistance from growth and sentiments headwinds in Q1 2021 – particularly the rising Covid-19 daily cases. However, policy backdrop will remain highly supportive. The upcoming stimulus package of near 900 billion USD – 2nd largest in US’ history – aims to provide direct handouts to household and relief for small businesses, which will deliver a much-needed boost to the US’ recovery next year.
- Looking ahead, we believe the organic growth of US economy and market could take off as quickly as the 2nd quarter of 2021. The notion is supported by favourable tailwinds such as (i) improving global growth outlook, (ii) lagged effects of measures this year, (iii) supportive policy backdrop and potentially (iv) the mass distribution of Covid-19 vaccine among US citizens.
- We expected earnings growth to recover in FY21 (+27.7% YoY) and FY22 (+17.2% YoY), driven by a healthy mix of secular and cyclical growth factors in the next few years.
- The Covid-19 pandemic has inadvertently accelerated the global economies’ transformation into an increasingly digitalised one and S&P 500 Index’s high technology weightage will continue to take advantage of such megatrends – i.e. double-digit earnings growth for technology giants like Apple, Amazon and Microsoft, regardless of Covid-19.
- With Fed’s monetary stance likely to be easy for the next 2-3 years, we have adjusted our fair PE ratio for S&P 500 Index upwards to 20.0X, from our previous value of 18.0X. We believe that the low rates environment supports a natural expansion in price multiples. The PE of 20.0X trades at one standard deviation above the S&P 500 Index’s 10-year mean PE.
- Applying the fair PE of 20.0X on our FY22 estimated EPS, we derived a target price of 4,400 for S&P 500 Index by end-2022. This represents an upside potential of +19% from yesterday’s (22 December) closing price.
- We think that US equities an attractive bet for the year ahead and upgrade our ratings for US equities to 3.0 Stars “Attractive” heading in 2021.
Recommended products for exposure to US
|
Sector/Product |
Active Funds |
Passive ETFs |
|
Small-Cap Growth |
||
|
Large Cap Growth |
Table 6: Upside Potential of US equities by end-2022
|
US S&P 500 Index |
FY2019 |
FY2020 |
FY2021 |
FY2022 |
|
PE ratio (X) |
22.3 |
24.9 |
19.5 |
16.7 |
|
Expected earnings growth (YoY %) |
0.8% |
-10.4% |
27.7% |
17.2% |
|
Earnings Per Share (EPS) |
163.8 |
146.8 |
187.5 |
220.0 |
|
Projected fair price (Based on 20.0X Fair PE ratio) |
3,276 |
2,935 |
3,750 |
4,400 |
|
Potential upside (%) |
- |
- |
- |
+19.1% |
|
Source: Bloomberg Finance L.P., iFAST estimates. Data as of Dec 2020. |
||||
Chart 12: Prices of US equities against its earnings growth projections

Chart 13: Performance of US funds on iFAST platforms over the last ten years

Europe 2021 Outlook – 3.0 Stars “Attractive”
- The macro recovery in Europe has been halted by the latest round of lockdown but leading indicators and high frequency data suggests Europe economy is healing. We see more upsides than downside risks for Europe’s growth in 2021, bolstered by a global cyclical recovery and heavy policy support.
- The near-term tactical case is strong, offering a favorable risk-reward. Driving near-term returns are i) value rotation which will have legs to run (Relatively Europe has a higher value exposure), ii) hefty cyclical earnings rebound in FY21, given high concentration of cyclical sectors and iii) possibly further Euro appreciation. Downside risk should be limited by policy actions, relatively lower valuation, and clearer geopolitical backdrop.
- We are expecting a cyclical earnings rebound in FY21 (48% YoY) and FY22 (17% YoY). It will be driven by the STOXX 600 index’s high concentration (more than 60%) of cyclical sectors which will contribute to more than 80% of FY21/22 earnings growth.
- Tepid earnings growth over the past decade has held back European equities’ return. For Europe equities to see longer-term returns, the cyclical earnings rebound must be sustained
- While valuation is fuller on an absolute basis due to the cratering of FY20 earnings, it is cheaper after accounting for FY21/22 earnings recovery and the cheapest amongst DM peers. For investors, Europe is great in mitigating valuation risks in a global portfolio.
- Europe equities (gauged by STOXX 600 index), in aggregate, are set to deliver a potential upside of 21% by end-2022. Given its strong tactical case, but a neutral long-term outlook, we assign a star ratings of 3.0 stars “Attractive” to Europe equities.
Recommended products for exposure to Europe
|
Category |
Products |
|
Actively Managed Fund (s) |
|
|
Passive Tracking ETF |
Table 7: Upside Potential of Europe equities by end-2022
| Europe (Stoxx 600 Index) | FY2019 | FY2020 | FY2021 | FY2022 |
| PE Ratio (X) | 16.1 | 23.2 | 15.7 | 13.4 |
| Expected Earnings Growth (YoY %) | 1.00% | -35.50% | 47.90% | 17.10% |
| Earnings Per Share (EPS) | 25.9 | 16.7 | 24.6 | 28.9 |
| Projected Fair Price (Based on 16.5X historical average PE Ratio) | - | - | - | 476.9 |
| Potential Upside from Today (%) | - | - | - | 22% |
| Source: Bloomberg Finance L.P., iFAST estimates. Data as of Dec 2020. | ||||
Chart 14: Prices of Europe equities against its earnings growth projections

Chart 15: Performance of European funds on iFAST platforms over the last ten years

Digital Economy 2021 Outlook – 2.5 Stars “Neutral”
- Expect to see a strong rebound in earnings post COVID-19, followed by double digit EPS growth over the next few years.
- We foresee that COVID-19 will play a role in accelerating the digitalisation process for many countries, benefitting internet companies.
- Long-term megatrends such as rising internet adoption rates and digital disruption remain intact and will continue to drive the growth of the Digital Economy.
- In the near-term, valuations are no longer as attractive as before. Since initiating coverage in August 2020 OGIG has risen by 30%. On a year-to-date basis OGIG has more than doubled.
- Taking a multi-year view, the Digital Economy is still an attractive sector for long-term investors given its immense growth prospects and earnings growth potential.
- Based on current valuations as well as the expected future earnings growth we have decided to downgrade the sector to 2.5 Stars “Neutral” rating from 3.0 Stars “Attractive”.
Recommended products for exposure to Digital Economy
|
Category |
Products |
|
Passive Tracking ETF |
Table 8: OGIG Projections 2021 – 2025
|
Digital Economy |
2020 |
2021 |
2022 |
2023 |
2024 |
2025 |
|
EPS |
195.00 |
292.50 |
438.75 |
570.38 |
712.97 |
855.56 |
|
Earnings Growth |
166.45% |
50% |
50% |
30% |
25% |
20% |
|
PE Ratio |
- |
69.91 |
46.61 |
35.85 |
28.68 |
23.90 |
|
Upside Potential from Today (%) |
||||||
|
Bull Case PE Ratio |
45 |
-35.6% |
-3.5% |
25.5% |
56.9% |
88.3% |
|
Base Case PE Ratio |
40 |
-42.8% |
-14.2% |
11.6% |
39.5% |
67.4% |
|
Bear Case PE Ratio |
35 |
-49.9% |
-24.9% |
-2.4% |
22.0% |
46.4% |
|
Source: Bloomberg Finance L.P., iFAST estimates. Data as of Dec 2020. |
||||||
Chart 15: Prices of Digital Economy equities against its earnings growth projections

Semiconductors 2021 Outlook – 3.0 Stars “Attractive”
- With COVID-19 nearly behind us, semiconductor sales has been recovering at a steady pace, posting a gain of 8.6% year-on-year in 3Q20 (Figure 3).
- Sales growth to remain robust in the coming years as the world becomes increasingly digitalised. Semiconductor demand to be supported by applications such as 5G & cloud computing.
- As the backbone of all electronic products and applications, semiconductors will be one of the most important sectors supporting the digital economy.
- The industry has not been as badly affected by the pandemic as previous expected. Even though earnings have been downgraded earlier in the year, they have already recovered beyond pre-COVID levels.
- The semiconductor industry has been one of the immediate beneficiaries of the pandemic as businesses speed up the adoption of technology, driving up demand for semiconductors.
- Since our last update in November, SMH has risen by 11%. Year-to-date it has risen by 54%.
- Even though expected earnings have recovered, we believe that they are still too pessimistic and might not have factored in the positive impact coming from the increased adoption of technology post-COVID-19.
- Based on our recently adjusted fair PE multiple of 20x, the semiconductor industry has a potential upside of 12.7% over the next 2 years. We maintain our star ratings for the semiconductor industry at 3.0 Stars “Attractive”.
Recommended products for exposure to Semiconductor sector
|
Category |
Products |
|
Passive Tracking ETF |
Table 9: Upside Potential of Semiconductor sector by end-2022
|
Semiconductors |
FY2020 |
FY2021 |
FY2022 |
|
PE Ratio (X) |
25.9 |
19.3 |
17.7 |
|
Expected Earnings Growth (YoY %) |
49.8% |
34.4% |
8.9% |
|
Earnings Per Share (EPS) |
163.4 |
219.6 |
239.2 |
|
Projected Fair Price (Based on 20.0X Fair PE Ratio) |
- |
- |
4,784 |
|
Potential Upside from Today (%) |
- |
- |
12.7% |
|
Source: Bloomberg Financials Ltd, iFAST estimates. Data as of Dec 2020. |
|||
Chart 16: Semiconductor sales growth year-over-year

Chart 17: Prices of Semiconductor sector against its earnings growth projections

Global Financial 2021 Outlook – 3.5 Stars “Attractive”
- In light of a potential vaccine roll-out, we remain positive on the global financial sector as the long-awaited rotation into value begins.
- Return of dividends and share buybacks: In the near term, we see the return of dividends and share buybacks as a share price catalyst for the banking industry, which makes up almost 50% of the index as of December 2020.
- Fall in loan loss provisions: Loan loss provisions is expected to ease in 2021, hence driving a strong earnings recovery in the global banks as loan loss provisions, the main culprit for the fall in earnings in 2020, taper off in subsequent quarters.
- Recovery in insurance premium: Global insurance premiums are also expected to recover in 2021 after contracting in 2020, with China leading the recovery.
- Support in net interest margins (NIM) as credit environment improves: Interest rates will remain low but there may be a level of support for NIM as the credit environment improves: banks could start redeploying their capital into higher-yielding assets such as loans, which will help to support the banks’ overall NIM.
- Earnings this year is expected to register a decline by 18.4%, before jumping by 20.4% and 15.1% to reach USD112.7 and USD129.7 in FY2021 and FY2022 respectively. We maintain our star ratings for the Global Financial sector at ‘3.5 stars’ Attractive.
- We expect investor sentiments to improve given a successful vaccine roll-out and possible resumption of dividend/share buyback across the banks. We have upgraded our fair PB ratio of 1.1X to 1.2X, which translates to an upside potential of about 23.5% by 2022E. The global financial sector is also offering an average dividend yield of 3.5% in the next two years.
Recommended products for exposure to Global Financial sector
|
Category |
Products |
|
Actively Managed Fund (s) |
|
|
Passive Tracking ETF |
Table 9: Upside Potential of Global Financial sector by end-2022
|
Global Financials |
FY2019 |
FY2020 |
FY2021 |
FY2022 |
|
PE ratio |
11.9 |
14.5 |
12.1 |
10.5 |
|
Earnings growth |
1.2% |
-18.4% |
20.4% |
15.1% |
|
EPS |
114.7 |
93.6 |
112.7 |
129.7 |
|
PB ratio |
1.1 |
1.1 |
1.0 |
0.9 |
|
Book value per share |
1,222.3 |
1,295.9 |
1,358.0 |
1,444.0 |
|
Projected fair price (based on 1.2X Fair PB ratio) |
- | - | - |
1,681.2 |
|
Potential upside from Today (%) |
- | - | - |
23.5% |
|
Source: Bloomberg Finance L.P., iFAST estimates. Data as of December 2020 | ||||
Chart 18: Prices of Global Financial sector against its earnings growth projections

Global Health Care 2021 Outlook – 3.0 Stars “Attractive”
- Near-term catalysts: A successful reopening of the global economy will likely drive positive rerating of earnings in some key growth segments given the pent up demand stemming from deferred surgeries and therapeutics.
- Medium-term catalysts: A successful vaccination roll-out in the coming months may bring about a ‘halo effect’ for the sector globally. Goodwill earned by healthcare companies during a pandemic reduces the probability of healthcare reforms over the next few quarters, which could reverse outflows relating to regulation risk
- Long-term catalysts: Demographics and innovation continue to be the main growth drivers for the industry. An ageing global population, emerging wealth, and healthcare innovation are structural trends that will drive future earnings growth for the sector
- We expect earnings to rise by 11% and 9% in FY21 and FY22 respectively. The rebound in the healthcare sector’s earnings pales in contrast to other cyclical sectors given that its earnings in relative terms were better shielded by recent economic disruptions.
- What could drive further earnings rerating potentially is a reduction in time for clinical trials. Less time needed to get drugs and therapies from development, to commercial roll out, has the potential to bring forward future earnings for these firms.
- The healthcare sector has historically performed well during post-recession periods due to their ability to pass down rising costs to consumers, as well as the sticky demand for their goods and services.
- Global healthcare companies have historically traded at a premium to global equities. A low interest rate environment could fuel further interest in a sector that has a good balance between growth opportunities and earnings stability
- We remain positive on secular growers within the healthcare sector; we expect higher beta industries such as healthcare technology, life sciences & tools, and healthcare equipment makers to outperform. We maintain our star ratings for the Global Healthcare sector at ‘3.0 stars’ Attractive.
Recommended products for exposure to Global HealthCare sector
|
Category |
Products |
|
Actively Managed Fund (s) |
|
|
Passive Tracking ETF |
Table 10: Upside Potential of Global Health Care sector by end-2022
|
Global Healthcare (MSCI ACWI Healthcare Index) |
FY2019 |
FY2020 |
FY2021 |
FY2022 |
|
Forward PE ratio (X) |
13.1 |
19.9 |
17.8 |
16.3 |
|
Expected earnings growth (YoY %) |
8.3% |
9.0% |
11.8% |
9.1% |
|
Est. Earnings Per Share (EPS) |
14.9 |
15.9 |
17.8 |
19.4 |
|
Projected fair price (Based on 18.0X fair PE ratio) |
268.2 |
286.2 |
319.5 |
348.5 |
|
Potential upside (%) |
- |
- |
- |
10.2% |
|
Source: Bloomberg Finance L.P., iFAST estimates. Data as of Dec 2020. |
||||
Chart 19: Prices of Global Health Care sector against its earnings growth projections

All materials and contents found in this site are strictly for general circulation and informational purposes only and should not be considered as an offer, or solicitation, to deal in any of the funds or products found/identified in this site. While iFAST Financial Pte Ltd ("IFPL") has tried to provide accurate and timely information, there may be inadvertent delays, omissions, technical or factual inaccuracies and typographical errors. Any opinion or estimate contained in this report is made on a general basis and neither IFPL nor any of its servants or agents have given any consideration to nor have they or any of them made any investigation of the investment objective, financial situation or particular need of any user or reader, any specific person or group of persons. You should consider carefully if the products you are going to purchase are suitable for your investment objective, investment experience, risk tolerance and other personal circumstances. If you are uncertain about the suitability of the investment product, please seek advice from a financial adviser, before making a decision to purchase the investment product. Past performance is not indicative of future performance. The value of the investment products and the income from them may fall as well as rise. Opinions expressed herein are subject to change without notice. In respect of any matters arising from, or in connection with the said research analyses or research reports, recipients of the report are to contact IFPL at 10 Collyer Quay, #26-01 Ocean Financial Centre Building, Singapore 049315, or by telephone at +65 6557 2853. Where the report contains research analyses or research reports from a foreign research house and if the recipient of such research analyses or research reports is not an accredited investor, expert investor, institutional investor or an ex-accredited investor, IFPL accepts legal responsibility for the contents of such analyses or reports to such persons only to the extent as required by law. Please note that only certain security(ies) herein are available to all investors, while the rest are only available for certain persons to invest in, such as Accredited Investors (as defined in the Securities and Futures Act) or one who invests at least S$200,000 (or its equivalent currency) per transaction. To qualify as an Accredited Investor, one needs to submit a declaration form and certain relevant supporting documents, according to iFAST’s prevailing policies and procedures.
Please read our full disclaimers on the website at ( https://secure.fundsupermart.com/fsmone/policies/328125/investment-account-terms-&-conditions).
iFAST Financial Pte Ltd (IFPL) (registered address: 10 Collyer Quay #26-01 Ocean Financial Centre Singapore 049315, Telephone: 6557 2000) holds the Financial Advisers Licence issued by the Monetary Authority of Singapore ('MAS') to conduct regulated activities of advising on securities, marketing of collective investment schemes and arranging of any contract of insurance in respect of life policies, other than a contract of reinsurance and the Capital Markets Services Licence issued by the MAS to conduct regulated activities of dealing in securities and providing custodial services for securities. While IFPL has made every effort to ensure the independence of the report's contents, IFPL's nature of business is such that IFPL and its connected and associated entities together with their respective directors, officers and staff may be involved in providing dealing or investment-related services in the abovementioned securities, and have taken or may take positions in the securities mentioned in this report, and may also act as the principal for any buy or sell trades.