

- Following the Fed’s half-point rate cut, Singapore REITs (S-REITs) have rallied. Despite the recent surge, the prices of S-REITs remain far from their historical peaks.
- Given our view of higher-for-longer rates, we remain cautious about the sustainability of the market rally due to the ongoing challenges for S-REITs.
- Investors should focus on the fundamentals of S-REITs as long-term success depends on strong capital management, balance sheet discipline, and income generation based on metrics like occupancy rates and rental reversions.
- After conducting a stress test on the 10 largest S-REITs, our top pick is CapitaLand Ascendas REIT (CLAR). Conversely, we recommend avoiding Keppel REIT (KREIT) and Suntec REIT (SUN).
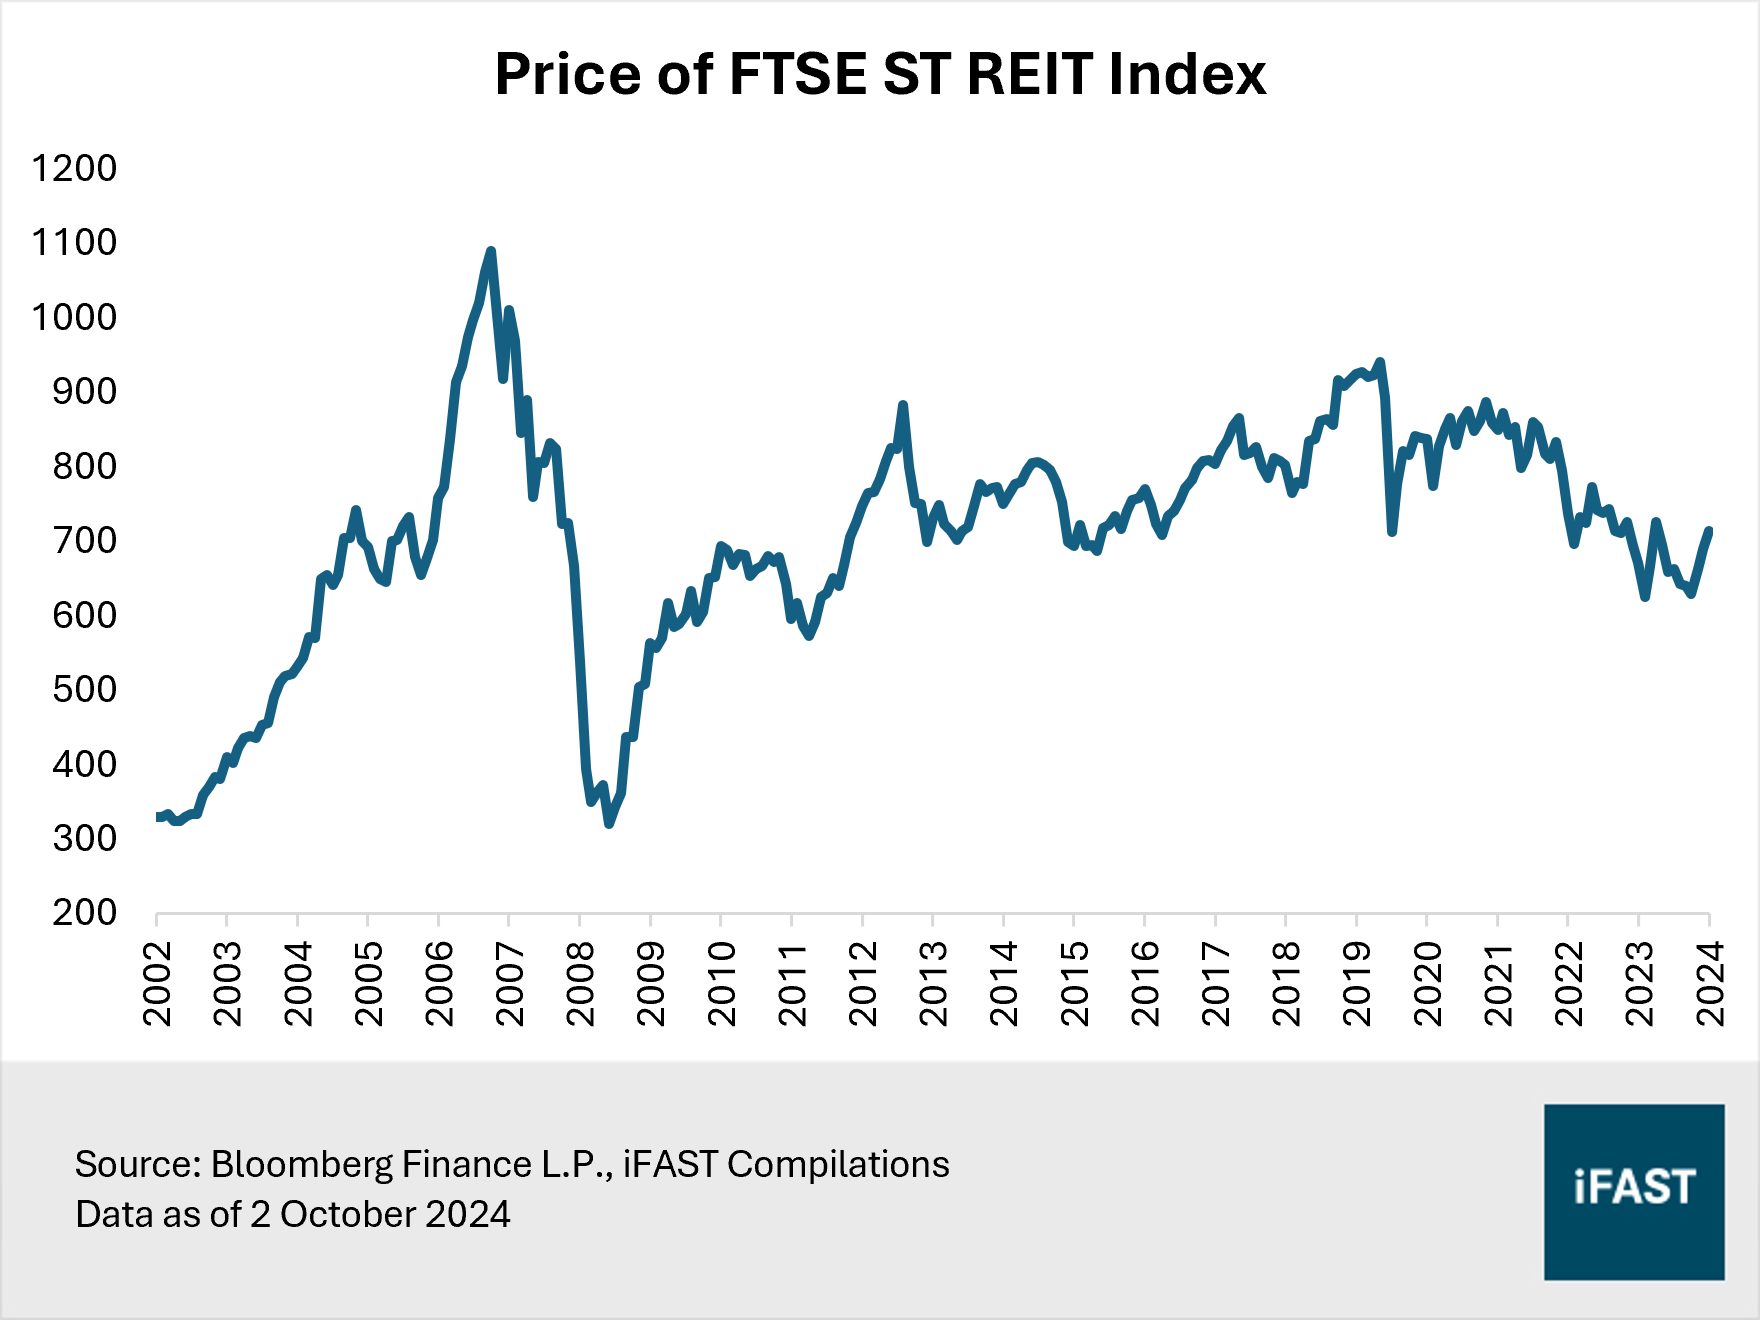
Following the Fed’s half-point rate cut in September – the first cut in more than four years – Singapore REITs (S-REITs), known for their sensitivity to interest rates, have experienced a noticeable recovery. The FTSE ST REIT Index, a proxy for S-REITs, has risen by about 15% in price terms since the beginning of the third quarter as markets anticipate a series of rate cuts, driven by signs of cooling US inflation and softer labour market data. Despite this recent surge, the prices of S-REITs remain far from their historical peaks (Figure 1).
Figure 1: S-REITs have rallied but are still far from historical peaks
On a sectoral level, office S-REITs saw the biggest rise in share prices (Figure 2). On average, they delivered returns of 50% since July, led by those focused on US office assets. The bottom-performing sector was hospitality, which delivered relatively flat returns on average. The sector was notably dragged down by ARA US Hospitality Trust which reported a 50% decline in distribution per stapled security (DPS) in the first half of the year.
Figure 2: Performance by sub-sectors

Caution is still warranted
The Fed's first rate cut in over four years, along with market expectations of more cuts, has generally improved sentiment toward S-REITs.
Looking ahead, the path for the sector as a whole will depend on the pace and magnitude of rate cuts. If the Fed moves aggressively to reduce rates while the economy remains resilient, S-REITs could experience further recovery. However, if aggressive cuts indicate economic weakness, S-REITs would likely struggle. Conversely, if inflation proves stickier than expected or if economic data does not deteriorate significantly, the current rally could stall, and S-REITs may face renewed headwinds.
In our view, the September cut does not signal the beginning of a typical rate cut cycle. The interest rate environment is likely to remain higher-for-longer, staying above pre-pandemic levels (i.e. era of near-zero interest rates is over).
We believe the descent in inflation remains bumpy and could take longer than expected to be under control. While the economy is slowing, it is not headed toward a recession, reducing the need for aggressive monetary easing, which could risk reigniting inflation. Fed Chair Powell also cautioned against assuming the half-point cut sets a pace that policymakers would continue, and remained optimistic about the economy, dismissing recession concerns.
While we will not rule out further Fed cuts, the market has currently priced in the likelihood of more aggressive rate cuts, expecting another three quarter-point cuts this year and four cuts in 2025, which may be overly optimistic. Markets often tend to overshoot on rate cut expectations. At the start of this year, there was an anticipation of at least six cuts in 2024, but these were quickly adjusted downwards along the way.
Should the narrative of steep rate reductions gets unravelled amidst upcoming sticky inflation or resilient economic data, we anticipate volatility in the interest rate-sensitive S-REITs. As such, we remain cautious about the sustainability of the market rally, given the ongoing challenging environment for S-REITs.
(Related article: The Fed has cut rates by 50bps – what should you do?)
Fundamentals do matter
Investors should remain focused on the fundamentals of S-REITs. While rate cuts can provide a tailwind, the real key to long-term success of S-REITs lies in the fundamentals, such as capital management and balance sheet discipline given the sector’s reliance on debt to drive growth.
All else being equal, rate cuts could lower borrowing costs and improve the profitability of S-REITs, particularly for those with a significant portion of debt on floating rates or with near-term refinancing needs. However, we anticipate a drag from the refinancing of lower-cost debt that was secured years ago prior to the rate hike cycle. Based on our stress test of the 10 largest S-REITs (Figure 3), we estimate that the cost of debt will still rise in a higher-for-longer rate environment, increasing by an average of 19%, which would lower distributions received by investors.
Figure 3: Higher cost of debt estimated after accounting for refinancing risks

Of which, Frasers Logistics and Commercial Trust (FLCT) could potentially see the largest increase in cost of debt. The overall cost of debt for FLCT remains low relative to peers, at 2.6% as of 30 June 2024. By contrast, the loan referencing rate – Singapore Overnight Rate Average (SORA) – currently stands at 3.5%.
Even if SORA were to continue to decline, we expect it to remain above its pre-pandemic levels of 2% due to a higher-for-longer interest rate environment (Figure 4). Companies are typically required to borrow at a spread above the loan referencing rate. Consequently, despite the short maturity of its debt of 2.0 years, we see potential for FLCT’s cost of debt to rise further, driven by the refinancing of older, lower-cost debt.
Figure 4: SORA likely to remain elevated, above pre-pandemic levels

Other S-REITs that could see substantially higher cost of debt include CapitaLand Ascott Trust (CLAS), Keppel REIT (KREIT), and Mapletree Logistics Trust (MLT) with reasons outlined in Table 1 below.
On the other hand, we think CapitaLand Ascendas REIT (CLAR) and Frasers Centrepoint Trust (FCT) may fare better than peers. Both CLAR’s and FCT’s current cost of debt are relatively elevated at 3.7% and 4.2% respectively versus that of 2.6% for FLCT. In particular, the overall cost of debt of CLAR should see a smaller increase due to its long term to maturity of 3.7 years.
Table 1: Debt profile of selected S-REITs
|
Name of S-REIT |
Cost of Debt |
% of Loan on Fixed Rate |
Average Term to Maturity (years) |
Comments |
|
CapitaLand Ascendas REIT (CLAR) |
3.7% |
83% |
3.7 |
Overall cost of debt likely to stabilise given high proportion of fixed rate debt and long term to maturity. |
|
CapitaLand Ascott Trust (CLAS) |
3.0% |
82% |
3.6 |
More room for cost of debt to increase as borrowings get refinanced at higher rates. |
|
Frasers Centrepoint Trust (FCT) |
4.2% |
67% |
2.8 |
Management has guided for cost of debt to maintain at low 4%, which based on our stress test, is reasonable as rates remain higher for longer. |
|
Keppel REIT (KREIT) |
3.3% |
65% |
3.0 |
While higher proportion of loans are floating rate, low cost of debt suggests that are likely to be refinanced at a higher rate. |
|
Mapletree Logistics Trust (MLT) |
2.7% |
83% |
3.7 |
Low cost of debt suggests that loans are likely to be refinanced at a higher rate. |
|
Source: Company filings, iFAST Compilations Data as of 30 June 2024 |
||||
Property valuations remain under pressure
Moreover, investors should evaluate not only how S-REITs manage their debt but also how they generate income, with a focus on key metrics such as occupancy rates and rental reversions.
SUN serves as a prime example, with notable declines in occupancy rates (Figure 5). As of 30 June 2024, the occupancy rate for its office portfolio had dropped to 95.1%, down from 98.6% a year earlier. Similarly, its retail portfolio occupancy slipped to 95.4%, compared to 97.5%. While rental reversions remain robust, they have shown signs of slowing. For instance, rental reversion for its Singapore offices eased to 7.9% in 2Q24, down from the double-digit growth seen in 2023. Additionally, DPU from operations for 1H24 was 1.2% lower year-on-year, and with the absence of capital distribution, DPU fell by 12.5%.
Figure 5: Occupancy rates have dropped after a recovery from the pandemic

We are also cautious about US office S-REITs. With new construction projects still entering the market and office demand remaining subdued, vacancy rates are expected to stay at record-high levels. Furthermore, distressed office loans remain a concern, and despite potential rate cuts, the era of near-zero interest rates has passed. As a result, the US office market is not yet out of the woods.
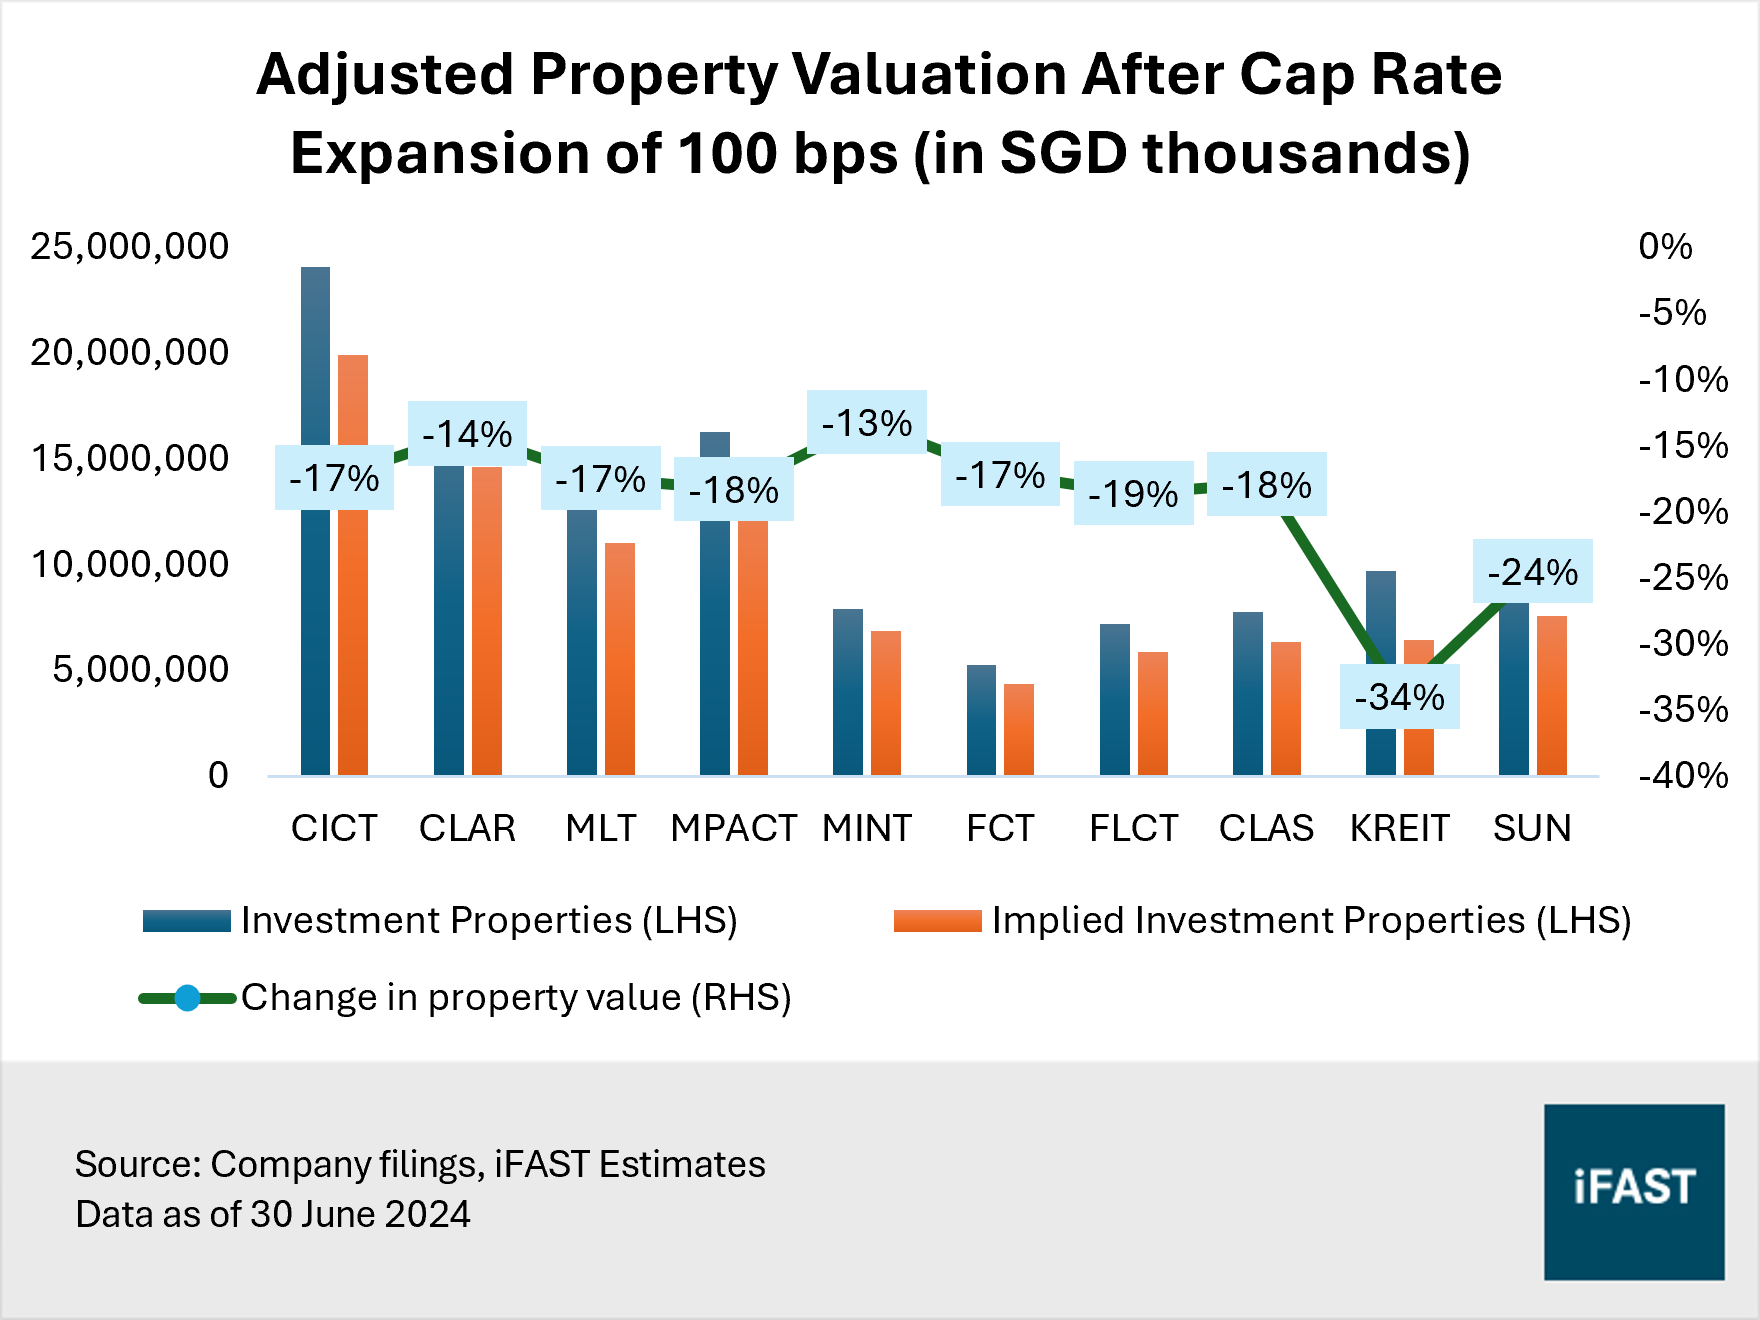
Property valuations are closely linked to net operating income and capitalisation rates (cap rates). Cap rates correspond to an investor’s required rate of return less the expected growth of the property. As interest rates stay elevated, so does the required rate of return, which poses the risk of cap rates experiencing upward pressure. This negatively impacts the value of properties held by S-REITs, assuming net operating income stays the same or deteriorates. Lower asset values, in turn, lead to the weakening of balance sheets.
To quantify the potential downside risk, we examined the impact of a 1% increase in cap rates on property values. All else being equal, our stress test on the 10 largest S-REITs shows that a 1% rise in cap rates would lead to an average decline of 19% in property valuations. The impact would be greater for KREIT and SUN, while lower for Mapletree Industrial Trust (MINT) and CLAR (Figure 6).
As property valuations decline, the net asset value (NAV) decreases, which could lead to weaker share prices. This is because, ideally, investors should pay the same price-to-NAV (P/NAV) multiple for the same REIT.
Figure 6: Property valuations could fall by an average of 19%
Following this, we assessed the impact of lower asset values on leverage ratios. In July 2024, MAS proposed that a single aggregate leverage limit of 50% apply to all S-REITs going forward, with the interest coverage floor (ICR) being 1.5 times. Our stress test indicates that both KREIT and SUN would exceed the regulatory leverage limit of 50% should cap rates expand by 1% (Figure 7). This not only restricts their ability to take on additional debt but also heightens concerns over future refinancing challenges. In contrast, S-REITs like FLCT and CLAR appear more resilient as they maintain lower leverage levels.
Figure 7: Potential impact on leverage

Be selective
In a nutshell, while S-REITs are a popular choice for income-seeking investors, the path ahead is fraught with uncertainty. Today, the S-REIT sector is currently offering a forward distribution yield of 6%. In our view, investors should be expecting a yield of 7-8% from the overall S-REIT sector. High-quality S-REITs could trade below this range, while S-REITs of poorer quality are expected to trade even higher than this figure.
A bottom-up, selective approach focusing on high-quality S-REITs with strong fundamentals will be key to outperformance. In our view, S-REITs with strong capital management and healthier balance sheets are better positioned to outperform in the long run. Furthermore, those with high occupancy rates and positive rental reversions could generate consistent and growing cash flows, which supports sustainable distributions to investors. Conversely, S-REITs struggling to maintain occupancy or possess excessive leverage will likely face greater challenges. At the sectoral level, we are cautious of US office properties due to ongoing risks.
After conducting a stress test on the 10 largest S-REITs, our top pick is CapitaLand Ascendas REIT (CLAR) (SGX:A17U) for its resilient fundamentals. Conversely, we recommend avoiding Keppel REIT (KREIT) (SGX:K71U) and Suntec REIT (SUN) (SGX:T82U) due to their high leverage ratios.
Investors may also receive a diversified exposure to S-REITs via the NikkoAM-StraitsTrading Asia ex Japan REIT ETF (SGX:CFA) or the Lion-Phillip S-REIT ETF (SGX:CLR).
Declaration:
For specific disclosure, at the time of publication of this report, IFPL (via its connected and associated entities) and the analyst who produced this report hold a NIL position in the abovementioned securities.
All materials and contents found in this site are strictly for general circulation and informational purposes only and should not be considered as an offer, or solicitation, to deal in any of the funds or products found/identified in this site. While iFAST Financial Pte Ltd ("IFPL") has tried to provide accurate and timely information, there may be inadvertent delays, omissions, technical or factual inaccuracies and typographical errors. Any opinion or estimate contained in this report is made on a general basis and neither IFPL nor any of its servants or agents have given any consideration to nor have they or any of them made any investigation of the investment objective, financial situation or particular need of any user or reader, any specific person or group of persons. You should consider carefully if the products you are going to purchase are suitable for your investment objective, investment experience, risk tolerance and other personal circumstances. If you are uncertain about the suitability of the investment product, please seek advice from a financial adviser, before making a decision to purchase the investment product. Past performance is not indicative of future performance. The value of the investment products and the income from them may fall as well as rise. Opinions expressed herein are subject to change without notice. In respect of any matters arising from, or in connection with the said research analyses or research reports, recipients of the report are to contact IFPL at 10 Collyer Quay, #26-01 Ocean Financial Centre Building, Singapore 049315, or by telephone at +65 6557 2853. Where the report contains research analyses or research reports from a foreign research house and if the recipient of such research analyses or research reports is not an accredited investor, expert investor, institutional investor or an ex-accredited investor, IFPL accepts legal responsibility for the contents of such analyses or reports to such persons only to the extent as required by law. Please note that only certain security(ies) herein are available to all investors, while the rest are only available for certain persons to invest in, such as Accredited Investors (as defined in the Securities and Futures Act) or one who invests at least S$200,000 (or its equivalent currency) per transaction. To qualify as an Accredited Investor, one needs to submit a declaration form and certain relevant supporting documents, according to iFAST’s prevailing policies and procedures.
Please read our full disclaimers on the website at ( https://secure.fundsupermart.com/fsmone/policies/328125/investment-account-terms-&-conditions).
iFAST Financial Pte Ltd (IFPL) (registered address: 10 Collyer Quay #26-01 Ocean Financial Centre Singapore 049315, Telephone: 6557 2000) holds the Financial Advisers Licence issued by the Monetary Authority of Singapore ('MAS') to conduct regulated activities of advising on securities, marketing of collective investment schemes and arranging of any contract of insurance in respect of life policies, other than a contract of reinsurance and the Capital Markets Services Licence issued by the MAS to conduct regulated activities of dealing in securities and providing custodial services for securities. While IFPL has made every effort to ensure the independence of the report's contents, IFPL's nature of business is such that IFPL and its connected and associated entities together with their respective directors, officers and staff may be involved in providing dealing or investment-related services in the abovementioned securities, and have taken or may take positions in the securities mentioned in this report, and may also act as the principal for any buy or sell trades.