

- While technology has become an indispensable part of our lives, investment opportunities abound in the digital economy, as digital technologies are expected to drive massive transformations and disruptions in the coming years.
- The digital economy can be broadly classified into eight segments that are worth approximately USD 9.5 trillion. If it were a national economy, the digital economy would be the third largest in the world, behind only the US and China.
- Despite expanding at an exponential pace in recent years, global Internet usage remains far from saturated. As Internet penetration picks up, the digital economy is likely to see promising growth over the next few years, with Internet companies being the main beneficiaries.
- Besides rising global Internet adoption, long-term secular megatrends in several areas including e-commerce, digital advertising, and cloud computing, will be major catalysts for future growth in Internet companies.
- We believe investors should consider an allocation to Internet companies in their portfolios using the O’Shares Global Internet Giants ETF (NYSE:OGIG).
The world as we know it has been radically transformed by technology.
Not only has it revolutionised the way we interact with one another – to the extent that digital tools are now our preferred mediums of communication – technology has also dramatically changed the way we consume information, entertainment, goods, and services.
Having sailed through multiple recessions and the dot-com bubble, the burgeoning digital economy has certainly come a long way since the first Internet domain name was registered in 1985. There are currently more than four billion Internet users worldwide, encompassing more than half of the world’s population.
While technology has already become an indispensable part of our everyday lives, investment opportunities abound in the digital economy, as the most powerful applications of digital technologies in the global economy remain largely untapped, and is expected to drive massive transformations and disruptions in the coming years.
What makes up the digital economy?
- e-Commerce: The e-Commerce boom has fundamentally transformed the way people shop for physical goods, with online retailers like Amazon.com (NASDAQ:AMZN) and Alibaba (NYSE:BABA) having an outsized impact on the broader retail market, forcing the traditional brick-and-mortar retailers to innovate and re-invent their businesses for the digital era.
- e-Services: The ubiquitous use of the Internet and mobile phones has also allowed online commerce to extend beyond physical goods to online services, triggering a flourishing e-Services segment that includes online food delivery, sales of event tickets, fitness (apps and wearables), and dating services.
- e-Travel: The e-Travel segment, which consists of online mobility services (such as online car rental, ride hailing, and carpooling) and online travel booking, has been heavily disrupted by digital business models over the years, with the industry experiencing a paradigm shift to online bookings over the years.
- Digital Media: The past decade has brought about massive changes in the way people consume entertainment. From Netflix (NASDAQ:NFLX) to Spotify (NYSE:SPOT), consumers are increasingly switching to online streaming services. Video games have also become mainstream, with more people than ever playing online games across various platforms, including PCs, consoles and mobile devices.
- Fintech: Financial technology (Fintech) makes up the lion’s share of the digital economy, and is mainly propelled by digital payments, which has seen surging adoption rates in recent years. While other digital financial services (remittance, robo-advisors, and alternative lending) are at a nascent stage, they are expected to see promising growth in the future and remain untapped opportunities in the digital finance space.
- Digital Advertising: With consumers spending increasing amounts of time on the Internet compared to traditional media, engaging with consumers is not the same as it was before. For firms looking to advertise their products, digital advertising is almost a necessity in order to maintain a strong online presence.
- Cloud Services: Cloud services provide the hardware and software components that are needed to support the data storage, computing and networking requirements of a business. As companies migrate a greater portion their workloads onto the cloud, the cloud computing industry is set to see explosive growth ahead, rendering traditional in-house or off-premises data warehouses obsolete.
- Cybersecurity: With growing amounts of data transmitted through the Internet, there is also an increasing demand for cybersecurity solutions to protect networks, computers and data from unauthorised access. Data breaches are far from being uncommon in the digital space, and can be extremely costly for the affected companies.
Collectively, the eight segments that make up the digital economy are worth approximately USD 9.5 trillion today (Table 1) – that’s approximately 10% of the world’s GDP. If it were a national economy, the digital economy would be the third largest in the world, behind only the US and China.
Table 1: The eight major segments that make up the digital economy
|
Segment |
Market Size (USD bil) |
Share of Digital Economy (%) |
|
Fintech |
5,492.3 |
57.7 |
|
e-Commerce |
2,027.9 |
21.3 |
|
e-Travel |
944.9 |
9.9 |
|
Digital Advertising |
331.5 |
3.5 |
|
Cloud Services |
213.5 |
2.2 |
|
e-Services |
190.0 |
2.0 |
|
Cybersecurity |
167.1 |
1.8 |
|
Digital Media |
150.0 |
1.6 |
|
Total |
9,517.2 |
100 |
|
Source: Statista, iFAST Compilations |
||
Rising Internet adoption represents growing opportunity for Internet companies
Despite expanding at an exponential pace in recent years, global Internet usage remains far from saturated. The number of Internet users worldwide currently represents about 58.7% of the global population, which means that a large part of the global population still lack access to the Internet or web-enabled devices.
Across the world, there are vast differences in the maturity and extent of digital services available in each region (Chart 1). North American and European countries are nearing Internet usage saturation, with penetration rates at 94.6% and 87.2% respectively.
The penetration rate in Asia, on the other hand, remains low relative to developed markets. This is despite the fact that Asian economies have a combined population exceeding four billion, accounting for over 55.1% of the global population. China, in particular, has the world’s largest population, yet Internet penetration in the country remains low at about 60%.
As the Internet penetration rate in Asia converges with developed markets, the digital economy is likely to see promising growth over the next few years, with Internet companies being the main beneficiaries.
Chart 1: Vast differences in the maturity of digital services available in each region

Moreover, the amount of time that consumers spend on the Internet has been rising over the years (Chart 2). In particular, mobile Internet usage has been picking up, and is expected to be the primary method that consumers use to access the Internet. This is unsurprisingly given that mobile Internet has enabled consumers to access the Internet and share information on the go.
Chart 2: Mobile Internet usage has been picking up over the years

With the global smartphone penetration rate at just 41.5%, the future for mobile Internet usage looks promising. Moreover, the future adoption of 5G mobile network technology means mobile load times will become virtually instantaneous, enabling consumers to transact and consume information on their smartphones as quickly as they can on their desktop PCs.
Besides rising global Internet adoption, long-term secular megatrends in several areas including e-commerce, digital advertising, and cloud computing, will be major catalysts for future growth in Internet companies.
e-Commerce has become a major part of our everyday lifestyles
Global e-commerce has come a long way since its inception. It is no longer just a fad, it has become a major part of our everyday lifestyles, with consumers across the world taking advantage of the convenience of ordering anything and having it delivered right to their doorstep. By 2023, global e-commerce is set to become a USD 6.5 trillion opportunity (Chart 3).
Chart 3: Global e-commerce set to become a USD 6.5 trillion market by 2023

China is currently the world’s largest e-commerce market, generating a total revenue of USD 867.6 billion in 2019, fueled by the increasing purchasing power of its local population. Its key market players include Alibaba (NYSE:BABA), JD.com (NASDAQ:JD) and Pinduoduo (NASDAQ:PDD), which collectively control close to 80% of China’s e-commerce market. The US is the second largest e-commerce market in the world, and Amazon (NASDAQ:AMZN) is the powerhouse that dominates the market, with a market share of close to 50%.
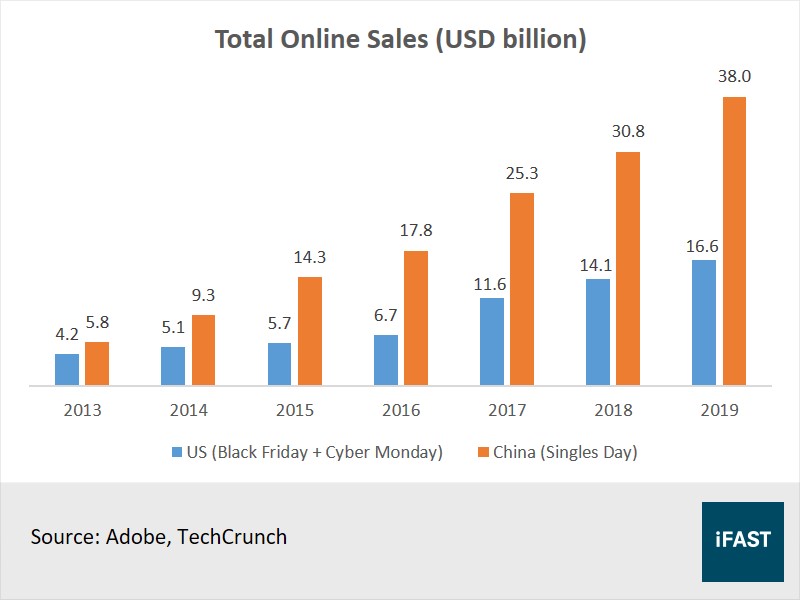
The spending power of consumers in the US and China does not look like it is slowing down anytime soon. In the US and China, there is no better indicator of consumer confidence than the Black Friday and Cyber Monday sales (in the US), and the Singles’ Day shopping extravaganza (in China). Even amidst the ongoing US-China trade war and a gloomy global economic outlook last year, these annual shopping events still managed to generate record sales in 2019 (Chart 4).
Chart 4: Annual shopping events generated record sales in 2019
Largest digital ad sellers to benefit from shift to digital advertising
Worldwide spending on digital advertising has surpassed traditional media (television, radio and print) for the first time in 2019, and unsurprisingly so.
Not only has the Internet changed shopping habits, it has also changed the way companies advertise their products. With consumers spending increasing amounts of time on the Internet compared to traditional media, digital advertising is now a necessity for companies that want to maintain a strong online presence.
The digital advertising market is expected to be worth USD 518 billion by 2023 – that’s a compounded annual growth rate (CAGR) of about 12% from 2019-2023 – making up 60% of the global advertising market. As the shift towards digital advertising continues, the largest digital ad sellers will likely be the main beneficiaries.
Alphabet (NASDAQ:GOOG, NASDAQ:GOOGL), or more commonly known as Google, and Facebook (NASDAQ:FB) are currently the largest players in the digital advertising market, with a combined market share of about 51.3% (Table 2). Meanwhile, China’s tech trio – Baidu (NASDAQ:BIDU), Alibaba (NYSE:BABA) and Tencent (HKEX:700) – are also a formidable force in the market given their dominance in China. While Amazon (NASDAQ:AMZN) remains a relatively small player, it has been steadily chipping away at the Google-Facebook duopoly in the US.
Table 2: Major global digital ad sellers
|
Company |
Net Digital Ad Revenues (USD bil) |
Market Share (%) |
|
|
103.73 |
31.1 |
|
|
67.37 |
20.2 |
|
Alibaba |
29.20 |
8.8 |
|
Amazon |
14.03 |
4.2 |
|
Baidu |
12.60 |
3.8 |
|
Tencent |
11.41 |
3.4 |
|
Microsoft |
6.44 |
1.9 |
|
Verizon |
4.84 |
1.5 |
|
|
2.97 |
0.9 |
|
Sina |
2.38 |
0.7 |
|
Source: eMarketer, iFAST Compilations Data as of February 2019 |
||
Cloud services and cybersecurity to thrive in data-driven world
The world’s most valuable resource is no longer oil, but data.
We live in a data-driven world, where big data is being generated by every digital process. The deep insight and knowledge that can be extracted from raw data through analytics is hugely valuable, and has drastically changed the landscape for business operations in recent years.
e-Commerce companies collect data to gain a deeper understanding of consumer preferences and shopping behaviours, enabling them to make personalised product recommendations and improve the overall online shopping experience. Digital advertising companies collect data on Internet users, analysing search terms and user habits to place targeted advertising alongside regular search results.
With about 41 zettabytes of data created worldwide in 2019, it will require a whopping 820 billion 50GB blu-ray disks to store all that data. Given the limitations of traditional storage solutions, cloud services have been gaining fast traction, with the ‘big three’ cloud providers – Amazon (NASDAQ:AMZN), Microsoft (NASDAQ:MSFT) and Alphabet (NASDAQ:GOOG, NASDAQ:GOOGL) – amongst the main beneficiaries (Chart 5).
Chart 5: Global cloud market dominated by Amazon, Microsoft and Google

The growing amount of data generated in the digital space also means that there is an increasingly need for cybersecurity measures and safe data storage solutions, to protect networks, computers and data from unauthorised access. Data breaches are far from being uncommon in the digital space, and can be extremely costly for the affected companies.
While the ‘big three’ cloud providers also offer cybersecurity services as part of their product offerings, the industry is highly fragmented with no one company dominating the market. The largest cybersecurity vendors in the market now are Cisco (NASDAQ:CSCO), Palo Alto Networks (NYSE:PANW) and Fortinet (NASDAQ:FTNT). Cloud-based upstarts like Zscaler (NASDAQ:ZS), Okta (NASDAQ:OKTA), and CrowdStrike Holdings (NASDAQ:CRWD) have also recently exploded onto the scene, giving established cybersecurity players a run for their money.
Chart 6: No clear dominant player in the global cybersecurity market

Exposure to major global Internet companies, all in one ETF
For investors who wish to incorporate some exposure to the digital economy in their portfolios, they can consider the O’Shares Global Internet Giants ETF (NYSE:OGIG), an ETF that provides investors with exposure to some of the largest global Internet companies that derive most of their revenue from the digital economy.
The ETF is constructed using a rules-based methodology designed to select stocks that not only derive at least 50% of their revenues from Internet technology or Internet Commerce, but also have exposure to the “quality” and “growth” factors.
The “quality” factor is determined primarily by cash burn rate, which is the monthly rate at which a company spends its supply of cash. Companies with a high ratio of cash burn rate to balance sheet cash and cash equivalents are excluded from the ETF. The “growth” factor is measured by revenue growth and stocks are assigned a growth rating.
Stock weightings in the ETF are determined according to a modified market capitalisation weighting method, using the full market capitalisation combined with the growth rating, subject to constraints for diversification and capacity. The ETF construction methodology yields a highly diversified portfolio, containing some of the fastest-growing Internet companies that span various segments in the digital economy.
The ETF currently has about 70 holdings in its portfolio, with 65.6% exposure to US companies and 22.6% exposure to Chinese companies. The top holdings in the ETF (Table 3) include the likes of Amazon (NASDAQ:AMZN), Alibaba (NYSE:BABA), Alphabet (NASDAQ:GOOG, NASDAQ:GOOGL), Tencent (HKEX:700), and Microsoft (NASDAQ:MSFT).
Table 3: Top holdings in OGIG ETF
|
Company |
Country |
Sector |
Weight (%) |
|
Amazon.com Inc |
US |
Consumer Discretionary |
6.79 |
|
Alibaba Group |
China |
Consumer Discretionary |
5.45 |
|
Alphabet Inc |
US |
Communication Services |
5.40 |
|
Microsoft Corp |
US |
Information Technology |
5.35 |
|
Tencent Holdings |
China |
Communication Services |
5.27 |
|
Facebook Inc |
US |
Communication Services |
4.08 |
|
Shopify Inc |
Canada |
Information Technology |
2.41 |
|
Pinduoduo Inc |
China |
Consumer Discretionary |
2.25 |
|
Crowdstrike Holdings |
US |
Information Technology |
2.03 |
|
Netflix Inc |
US |
Communication Services |
2.01 |
|
Top 10 Holdings |
41.0 |
||
|
Source: O’Shares ETF Investments Data as of 20 April 2020 |
|||
With an estimated PE ratio of 46.4X based on 2021 estimated earnings, the OGIG ETF may look wildly overpriced, especially when compared to the NASDAQ 100, the MSCI AC World Information Technology Index, as well as the broader S&P 500 Index. It must be noted, however, that the higher PE ratio of OGIG ETF also comes along with a much higher revenue and earnings growth.
If we look at the PEG ratio, which we believe is a much fairer metric as it adjusts the traditional PE ratio by taking into account earnings growth, it reveals a much different picture, with the OGIG ETF undervalued relative to the NASDAQ 100 and the MSCI ACWI Information Technology Index.
Table 4: Valuations of notable indices
|
Index |
PE Ratio |
PS Ratio |
PEG Ratio |
3Y Earnings Growth (%) |
3Y Sales Growth (%) |
Net Debt-To-Equity (%) |
|
O’Shares Global Internet Giants |
46.4 |
4.14 |
0.93 |
49.7 |
21.2 |
-23.8 |
|
NASDAQ 100 Index |
20.3 |
3.23 |
1.55 |
13.1 |
7.0 |
29.7 |
|
Technology Select Sector Index |
18.9 |
4.22 |
1.54 |
12.3 |
5.6 |
14.3 |
|
MSCI ACWI Info Tech Index |
17.7 |
2.66 |
1.16 |
15.2 |
3.1 |
5.3 |
|
S&P 500 Index |
16.5 |
1.91 |
2.09 |
7.9 |
3.1 |
55.0 |
|
Source: Bloomberg Finance L.P., iFAST Compilations Data as of 21 April 2020, multiples based on 2021 estimates |
||||||
The global economy is undergoing a digital transformation, and it’s happening at breakneck speed. The rise of the digital economy has blurred geographical boundaries, redefining how consumers obtain goods and services. With digital technologies expected to drive massive transformations and disruptions in the coming years, we believe investors should consider an allocation to Internet companies in their portfolios.
Declaration:
For specific disclosure, at the time of publication of this report, IFPL (via its connected and associated entities) holds a NIL position in the abovementioned securities. The analyst who produced this report has a position in O’Shares Global Internet Giants ETF.
All materials and contents found in this site are strictly for general circulation and informational purposes only and should not be considered as an offer, or solicitation, to deal in any of the funds or products found/identified in this site. While iFAST Financial Pte Ltd ("IFPL") has tried to provide accurate and timely information, there may be inadvertent delays, omissions, technical or factual inaccuracies and typographical errors. Any opinion or estimate contained in this report is made on a general basis and neither IFPL nor any of its servants or agents have given any consideration to nor have they or any of them made any investigation of the investment objective, financial situation or particular need of any user or reader, any specific person or group of persons. You should consider carefully if the products you are going to purchase are suitable for your investment objective, investment experience, risk tolerance and other personal circumstances. If you are uncertain about the suitability of the investment product, please seek advice from a financial adviser, before making a decision to purchase the investment product. Past performance is not indicative of future performance. The value of the investment products and the income from them may fall as well as rise. Opinions expressed herein are subject to change without notice. In respect of any matters arising from, or in connection with the said research analyses or research reports, recipients of the report are to contact IFPL at 10 Collyer Quay, #26-01 Ocean Financial Centre Building, Singapore 049315, or by telephone at +65 6557 2853. Where the report contains research analyses or research reports from a foreign research house and if the recipient of such research analyses or research reports is not an accredited investor, expert investor, institutional investor or an ex-accredited investor, IFPL accepts legal responsibility for the contents of such analyses or reports to such persons only to the extent as required by law. Please note that only certain security(ies) herein are available to all investors, while the rest are only available for certain persons to invest in, such as Accredited Investors (as defined in the Securities and Futures Act) or one who invests at least S$200,000 (or its equivalent currency) per transaction. To qualify as an Accredited Investor, one needs to submit a declaration form and certain relevant supporting documents, according to iFAST’s prevailing policies and procedures.
Please read our full disclaimers on the website at ( https://secure.fundsupermart.com/fsmone/policies/328125/investment-account-terms-&-conditions).
iFAST Financial Pte Ltd (IFPL) (registered address: 10 Collyer Quay #26-01 Ocean Financial Centre Singapore 049315, Telephone: 6557 2000) holds the Financial Advisers Licence issued by the Monetary Authority of Singapore ('MAS') to conduct regulated activities of advising on securities, marketing of collective investment schemes and arranging of any contract of insurance in respect of life policies, other than a contract of reinsurance and the Capital Markets Services Licence issued by the MAS to conduct regulated activities of dealing in securities and providing custodial services for securities. While IFPL has made every effort to ensure the independence of the report's contents, IFPL's nature of business is such that IFPL and its connected and associated entities together with their respective directors, officers and staff may be involved in providing dealing or investment-related services in the abovementioned securities, and have taken or may take positions in the securities mentioned in this report, and may also act as the principal for any buy or sell trades.