


In a rising interest rate environment, investors should always buy short-dated bonds.
Does this statement sound familiar?
Erstwhile held by a narrow circle of fixed income specialists, this view has become somewhat of a mantra among the general population, oft-repeated by all and sundry, professionals and non-professionals alike. It is heard at dinner parties, where general discussions on the economy inevitably turn to investment strategies wherein one might mitigate 'interest rate risk'. It is also heard at high-level investment seminars, where all manner of investment experts and thought leaders, immaculately dressed in tailored suits, proffer their latest insights and newfangled investment strategies. So popular and widely shared is this idea that one would be hard-pressed to find anybody within his circle of friends that has yet to hear of it.
In its most basic form, the reasoning goes as follows: After a sustained period of rate declines, interest rates are close to zero or in negative territory. There is no way but for interest rates to go back up. Because bond prices decline when interest rates rise and long duration bonds are more sensitive to interest rate hikes, one should invest exclusively around the shorter end of the curve.
Is this line of reasoning sound? In other words, is it true that in a rising interest rate environment, one should only buy short-dated bonds?
Implicit in this statement are a number of assumptions on which the conclusion, that one should buy short-dated bonds, rests. Is it true that we are in a rising interest rate environment? Do long-dated bonds always generate negative investment returns in a rising interest rate environment?
Does the pace of interest rate hikes matter? Would it matter if we had a flat yield curve or a positive sloping one, and would our conclusion change depending on the situation? Do corporate yield curves take the same shape as the sovereign curve or do these curves differ (in shape)?
The introduction of these considerations is understandably overwhelming, and to a certain extent, complicates the simple 'buy' and 'sell' narrative. However, bond investment is necessarily a nuanced subject and we would be doing our readers a disservice if we were to offer fallacious conclusions based on overgeneralization and weak assumptions.
This article will focus on the following issues. Firstly, we provide a brief overview of the interest rate environment, past and present, and the current stance of policymakers. We will then address the conventional wisdom that one should always stay at the short end of the curve in a rising interest rate environment, and reveal the fallacious nature of this argument.
After that, we will examine how investors can capture significant roll-down profits by investing in the long end of the curve. Lastly, we will list a number of key bond investment ideas that we find especially compelling at this point of time.
How Low or High Can Interest Rates Go?
' I'm not smart enough to know if it's going to be inflation or deflation. The smart money knows that it could be either one, so you need to prepare for both.'
- James K. Rickards
Interest rate policy in the United States is driven by the US Federal Reserve, colloquially known as the Fed. Within the institution, the Federal Open Market Committee ('FOMC') meets on a regular basis (every two months during the fiscal year) to discuss and decide policy actions on matters including interest rates, monetary supply, and the purchase and sale of Treasury securities.
The Fed influences global interest rates by setting two key benchmark rates under its purview: The federal funds rate and the Fed discount rate. The federal funds rate is the rate at which financial institutions lend funds held at the Fed to each other on an overnight basis, while the Fed discount rate is the rate which the Fed charges its member banks for funds to maintain the reserves they require. Market participants generally pay close attention to the evolution of the Fed funds rate as it directly reflects the cost of interbank borrowing and impacts other interest rate benchmarks globally.
US monetary policy has experienced many changes throughout history. After President Nixon abandoned the gold standard in favor of a free-floating US dollar in 1973, the United States experienced a period of runaway inflation, which surged from 3.9% to 9.6%.
In a desperate attempt to put a lid on inflation, the Fed doubled interest rates from 5.75% to 11%. Its efforts to strike a balance between controlling inflation rate as well as limiting unemployment were to no avail and confounded businesses, which continued to keep prices high. The cycle of guessing and second-guessing continued all the way to 1979, when the Fed funds rate reached a high of 20% before declining.
The Fed also proved to be equally adept at lowering interest rates. In 2008, with the US economy in the throes of recession caused by the subprime mortgage crisis, the FOMC lowered the target for the Fed funds rate to almost zero.
In November 2008, with the economy still in a state of disarray following the collapse of Lehman Brothers, the Fed announced that it would purchase up to USD 600 billion in agency mortgage-backed securities to release liquidity into the system. The parlous state of affairs would endure for some time, and the Fed announced a third round of quantitative easing, an exercise involving an open-ended commitment to purchase USD 40 billion of agency mortgage-backed securities per month until the labor market improved substantially.
The Fed funds rate reached zero territory in 2011, and the Fed only increased the benchmark rate for the first time since June 2006 in December 2015, more than five years after the financial crisis broke out.
Today, the target range for the fed funds rate is at the low range of 2.25-2.50%, and it appears that the Fed might have hit the brakes on raising interest rates, at least in the near term. The current Fed chair, Jerome Powell, has even signaled his willingness to cut interest rates if necessary.
Across the Atlantic, the European Central Bank ('ECB') has been even more explicit, excluding the possibility of any rate hike occurring 'at least through the first half of 2020'. Market participants have taken the cue, with Fed funds futures contracts putting the implied probability of a rate hike occurring within the next twelve months at 0%.
What are the lessons that may be drawn from these events in history? For one, we may observe that interest rate cycles play out over long periods of time. The trajectory tends to be unpredictable, with innumerable twists and turns. The uncertain trajectory aside, it is also not easy to predict how high or low interest rates will go, much less pinpoint when any given rate increase or decline might occur.
What is clear though is that interest rate cycles seem to stretch over a long period of time in some sort of a mean-reverting process. An investor might assume that in a rising or low interest rate environment, rates will go up eventually. But this assumption can only tested by investors with an indefinite or ultra-long investment horizon.
An investor with an investment horizon of a year or two has to grapple with the possibility that rates might remain low during his or her holding period. That would seem to be the case if we were to take our cue from the Fed or ECB. In that scenario, the 'rising rate environment' would be a mischaracterization.
The Logical Fallacy of Buying Short-Term Bonds
Proponents of buying short-term bonds typically adhere to the following line of reasoning:
Firstly, they argue that the Fed has lowered interest rates significantly. Because current rates are presently below their long-term averages, investors should prepare for the eventual 'normalization' of the interest rate environment. The return of inflation would mean that the Fed will keep on hiking interest rates, and this would be deleterious to the value of long duration bonds.
The second argument advanced by advocates of short-term bonds is the flat yield curve currently observed. Since 2010 and in the years following the financial crisis, the yield curve has flattened considerably, with the spread between two-year and ten-year Treasuries falling from approximately 2.75% to just 0.24% today.
The proponents of short-term bonds argue that when the yield difference between a two-year security and a ten-year one is almost negligible, there is no incentive for an investor to buy the ten-year bond. Rather one should just stick to the two-year note and reinvest the proceeds upon maturity.
The problem with these arguments is they ignore what may be termed 'path risk'. Even though it may be true that we might see an eventual 'normalization' of rates, there is a significant possibility that rates may decline first before rising. To assume that rates will increase in a straight line to their long-term equilibrium is incomplete thinking. Moreover, signals from various central banks and interest rate futures markets indicate that this (a non-linear interest rate path) will be the more likely scenario.
The other aspect neglected by proponents of the short-term bond strategy is the difference in credit risk premium as we move along the curve. Credit risk premium or credit spread refers to the additional yield (or yield premium) over and above the sovereign curve (or some other index depending on the market) when one invests in a corporate bond. This yield premium is not constant over different maturities ; in fact, longer maturity corporate bonds typically offer greater credit spreads i.e. higher yield premiums or wider Z-spreads.
Furthermore, corporate bond curves do not necessarily resemble or take the same shape as the sovereign yield curve. To see what this means in practical terms, we invite you to take a look at two charts.
Figure 1 depicts the structure of the current US Treasury curve, while Figure 2 illustrates the current shape of the yield curve of UBS AG , one of Switzerland's largest banks.
Figure 1: US Treasury Yield Curve
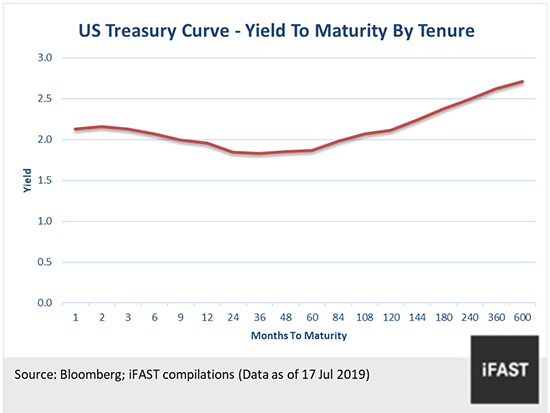
Figure 2: UBS AG Yield Curve
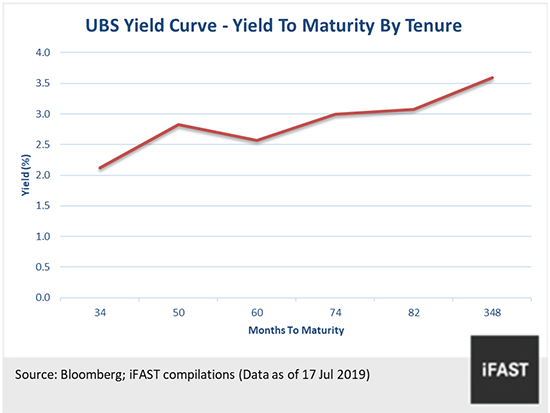
A quick visual inspection would inform us that the two curves are not identical and certainly do not bear the same shape. The US Treasury curve has a rather flat slope and is inverted at the front end, but we would be hard-pressed to say the same of the UBS curve. In fact, the UBS curve appears to be relatively 'normal' i.e. broadly upward sloping, with some portions steeper than others.
The idea that we should limit ourselves to buying short-term corporate bonds is a fallacy, premised on the erroneous assumption that corporate bond curves strictly follow the shape of the Treasury or other benchmark curves. Yet we can see from the above example that this is demonstrably inaccurate.
This is not to say that we should close our eyes to the level and shape of the Treasury curve. Indeed, it remains a very useful tool in informing us what a corporate yield curve might look like, but it should not be used as a heuristic to arrive at sweeping conclusions such as 'buy short-term corporate bonds only'.
At this point in our analysis, we propose a brief detour to explore the concept of forward rates and how they relate to yield to maturity. Forward rates inform us on the evolution of future short-term rates, which in turn, allow us to determine whether it would be more ideal to invest in short- or long-term bonds.
Understanding Forward Rates
The forward rate is the calculated expectation of the yield on a bond that, theoretically, occurs in the future. To better understand what a forward rate is, consider the following scenario:
You are presented with two investment options:
1. Purchase a Treasury bond that matures in one year. On maturity, purchase a second one-year Treasury bond.
2. Purchase a two-year Treasury bond
In this example, let us assume that the one-year bond in the first option yields 10% per annum and that the two-year bond in Option 2 yields 15% per annum.
The attentive reader would have, at this juncture, noticed that we failed to specify the yield of the second one-year Treasury bond in Option 1, which is to be purchased in a year's time once the first bond matures. The reason is simple: It is impossible for the investor to know beforehand the yield of the second bond to be purchased one year into the future.
Nonetheless, it is possible to calculate the interest rate (represented by x% in the equation below) that the second bond, to be purchased one year into the future, has to yield in order for the investor to generate the same investment return, whether he adopts Option 1 or Option 2.
(1+10%)(1+x%)=(1+15%)^2
Solving the above equation for x gives us 20.2%. In other terms, in order for the investor to be indifferent between two options, the second bond in Option 1 would have to yield 20.2%.
It might be clear by now that the 20.2% figure derived is none other than the forward rate : the breakeven one-year reinvestment rate a year into the future. Furthermore, if we assume that the Treasury curve reflects the market's best estimate of future interest rates, then it follows that the forward rate of 20.2% represents the market's expectation of the one-year bond yield one year into the future.
Taking the approach described in the preceding paragraph, we can construct a full forward yield curve for the US Treasury spot curve. Figure 3 displays the spot and forward curves of US Treasuries in June 2018. At that point in time, three-month yields were slightly under 2%, while the three-month forward yield was above 2.5% for most parts of the curve.
Figure 3: US Treasury Spot and Forward Yield Curves (June 2018)
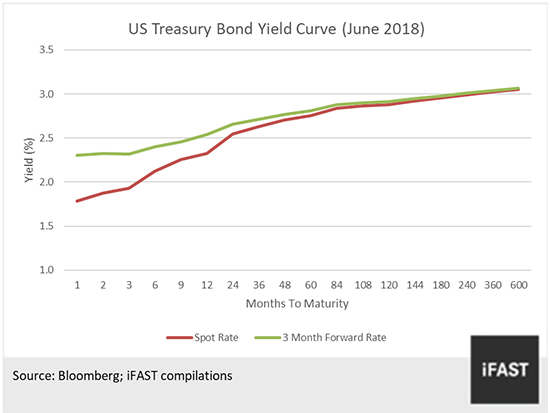
We remember that the forward curve represents the breakeven levels of future spot rates, i.e. the rates that would make bonds of different maturities earn the same one-period return.
The reader might notice that the three-month forward curve in this example is situated above the spot curve and comfortably above the 3-month spot yield of under 2%. Since forward rates represent the breakeven levels for future spot rates, they are indicating that a long-dated bond investment would outperform a short-dated one if short-term rates don't increase in a way that is reflected in the forward curve.
Another way of interpreting the curves is since the forward curve consistently exceeds short-term spot rates, there is significant risk for an investor that holds cash or invest in short-term bond investments.
At the risk of belaboring the same point, when the forward curve is substantially and significantly above current short-term rates, it is likely that a long-dated bond investment will outperform an investment strategy of buying a short-term bond and reinvesting the proceeds continually.
The forward curve is situated above the spot curve most of the time. This is not always the case, however.
Figure 4 shows the US Treasury spot and forward curves in the month of June this year. The astute reader would quickly observe that the forward curve in this case is situated for a significant part below the spot curve. In this situation, breakeven future rates are lower than existing short-term rates, which implies that the market is expecting short-term rates to move lower going forward.
Figure 4: US Treasury Spot and Forward Yield Curves (July 2019)
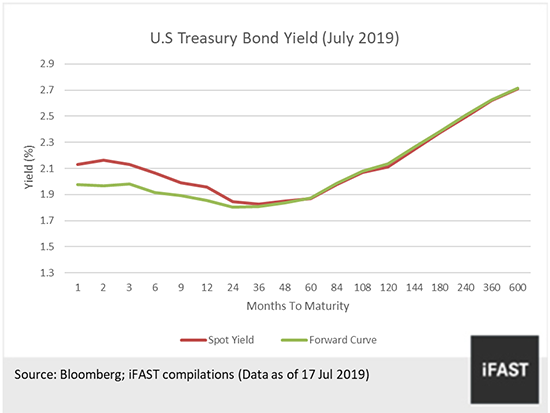
An important caveat: Earlier, we alluded to the importance of making the distinction between the Treasury curve and the individual corporate bond yield curve, which may not necessarily take the same shape. The yield and forward curves are issuer specific : when the forward curve is under the spot curve for Treasuries, it is entirely possible for the forward curve to stay above the spot curve for a corporate issuer, at a given moment in time.
A better understanding of forward and spot curves notwithstanding, we have yet to resolve the question of whether and when it is better to buy long-term bonds. Before we can do so, we need to understand another important concept: the roll-down strategy.
A Primer on Bond Roll-Down
Table 5 shows a list of selected bonds , arranged in order of maturity , issued by UBS, one of Switzerland's largest banks.
Figure 5: Selected UBS Bonds in Order of Maturity
Tenor |
Reference Security |
Price in USD (Ask) |
Yield To Maturity (Ask; %) |
1 Year |
UBS 2.20% 08Jun2020 Corp (USD) |
99.95 |
2.25 |
5 Years |
UBS 2.14% 03Jul2024 Corp (USD) |
98.64 |
2.43 |
6 Years |
UBS 7.50% 15Jul2025 Corp (USD) |
122.12 |
3.39 |
Source: Bloomberg, iFAST compilations (Prices as of 17 July 2019) |
|||
If we buy the one-year UBS bond yielding 2.25% and hold it to maturity, our investment return over a one-year period is 2.25%.
What happens if we were to invest in the six-year bond instead? If we hold it to maturity, we would earn a yield to maturity of 3.39% at the price indicated in Figure 5. But what if we hold it for only one year before selling the bond in the secondary market? What would our investment return be?
The key here is to realize that after purchasing the six-year bond and holding it for one year, it becomes a five-year bond. If the yield curve remains unchanged over the one-year period, the yield on the six-year bond in one year should be equal to the yield of the five-year bond today. Given this information, we can calculate the approximate return of buying the six-year bond and selling it after one year.
A normal upward sloping yield curve has long-dated bonds at higher yields and short-dated bonds at lower yields. If the curve is upward sloping, the five-year bond would carry a lower yield compared to a six-year one. When one year has passed and assuming that there is no change to the structure of the yield curve, the six-year bond becomes a five-year one carrying a lower yield. Because the coupon of a bond is fixed, its price has to go up to adjust for the lower yield.
The gain from price appreciation due to the bond evolving from a six-year to five-year security is known as the 'roll-down' return : a 'secret' source of profit known to astute bond investors. While many cling on the misconception that a rising interest rate environment would invariably lead to losses on long-term bonds, canny investors are investing in selected long-term bonds to capture the roll-down return.
To understand how the roll-down effect can be quantified, we return to the UBS example. To this end, a simple rule of thumb can be employed:
Roll-down Gain = Yield Difference times Residual Duration (may be approximated by tenure)
In the case of UBS, the yield difference between its six- and five-year bonds is 0.96% (3.39% -2.43%). The residual duration of the bond may be approximated by its remaining tenure of five years. Thus, the estimated gain from rolling down is 4.8%.
But that is not the only source of profit. We also have to account for the coupons paid during the one-year holding period. With a 7.5% coupon and at the purchase price of 122.12, we have a return of approximately 6.1% a year.
Thus the total estimated return for this example is about 10.9%, about 8 percentage points over and above the 2.25% return associated with buying the one-year bond and holding it to maturity. The total return of about 10.9% is not just from the roll-down effect, but also from the higher credit compensation associated with holding a longer dated bond.
At this juncture, the perceptive reader might point out that the above analysis is premised on the assumption that the yield curve remains unchanged during the holding period. This is certainly true, nonetheless it does not negate the factual basis of the roll-down effect.
Firstly, changes to the slope can be positive to the roll-down strategy (where the slope becomes even steeper, thus accentuating the roll-down effect). Even if the curve flattens, the strategy will only see a capital loss if the curve flattens and inverts to the extent that short-term yields exceed long-term yields. Rare is this occurrence and even in such an unlikely scenario, the investor still has the option of holding the bond to maturity and capturing the yearly coupon in the process. Indeed, one of the inherent advantages that bonds possess over other asset classes is their fixed maturity date. But we digress.
The power of the roll-down strategy can be amply illustrated with one of UBS' bonds, the UBS 4.125% 15Apr2026 Corp (USD), which was an 8-year bond the previous year (and is currently a seven-year bond). In June last year, the bond was trading at 98.7 cents on the dollar. By June this year, the bond was trading at 106.432 cents on the dollar.
The one-year percentage gain on principal was approximately 7.8%, before taking into account the coupons received during the intervening period. Together with the coupons received, an investor would have reaped in excess of 10% in one year. Even though the 7.9% price increase was not entirely due to the roll-down (it was also significantly attributable to lower long-term rates) , it illustrates the potent potential returns from a roll-down strategy (buying a long-term bond and selling it before maturity) instead of holding a short-term bond to maturity.
How to Find the Best Roll-Down Opportunities
The best roll-down opportunities are to be had at the steepest part of the yield curve : the part where the change in yield from one tenure to another is the greatest. We make this observation with an important caveat: that the shorter the bond maturity, the lower its price sensitivity to changes in yield.
The reader might recall that the roll-down gain is the product of the yield difference and residual duration (or approximate tenure). While the yield difference is material, so is the residual duration of the bond. If we position ourselves at the short end of the curve, and even if the short end has the steepest slope, the lack of duration (both credit spread duration and interest rate duration) limits our roll-down gains significantly. Rather, in most cases it is optimal for the investor to position himself between the 3- to 10-year part of the yield curve.
Our Best Roll-Down Ideas
At iFAST, we scour the world for the best ideas so that you can invest profitably. As a value-added service to our esteemed readers, we have done the heavy lifting and selected a number of bonds that we believe provide attractive roll-down opportunities now. The estimated returns suppose a one-year holding period where the investor purchases the bond and sells it after one year.
1. UBS Group Funding (Switzerland) AG: UBS 4.253% 23Mar2028 Corp (USD)
Years to Maturity |
8.3 |
Ask Yield (to Maturity) |
3.30% |
Estimated 1-Year Roll-Down Return (Excluding Coupons) |
3.39% |
Estimated 1-Year Investment Return (Including Coupons) |
7.36% |
Source: Bloomberg, iFAST compilations |
|
Another UBS issue, denominated in SGD, that may be of interest to investors is the UBS 5.875% Perpetual Corp (SGD). The issue has a yield to call of approximately 4.73% per annum. (See UBS AG: The Aftermath of a $48 billion Meltdown)
2. Credit Suisse Group: CS 4.282% 09Jan2028 Corp (USD)
Years to Maturity |
8.5 |
Ask Yield (to Maturity) |
3.60% |
Estimated 1-Year Roll-Down Yield (Excluding Coupons) |
7.28% |
Estimated 1-Year Investment Return (Including Coupons) |
11.3% |
Source: Bloomberg, iFAST compilations |
|
Another issue, denominated in SGD, that may be of interest is the CS 5.625% Perpetual Corp (SGD), which has a yield to call of 5.19% per annum.
3. Oxley Holdings Limited: OHLSP 5.700% 31Jan2022 Corp (SGD)
Years to Maturity |
2.6 |
Ask Yield (to Maturity) |
9.07% |
Estimated 1-Year Roll-Down Yield (Excluding Coupons) |
3.92% |
Estimated 1-Year Investment Return (Including Coupons) |
10.1% |
Source: Bloomberg, iFAST compilations |
|
Conclusion
A significant majority in the population continue to cling on to the notion that in a rising rate environment, one should invest in short-term credits at the exclusion of long-term bonds. We have seen that this generalization is based on a number of erroneous assumptions, chief among which is the idea that interest rates will go up quickly and in a straight line. Certainly this is not a given, and is in all likelihood not about to materialize, given the lackluster outlook on the global economy.
We introduced the concept of forward rates, and illustrated how forward rates estimate the future levels of spot rates. In addition, forward rates also help us to determine the breakeven rates , the rates at which the redemption proceeds from a short-term bond must be reinvested in order for us to earn as much compared to investing in a long-term bond.
The concept of forward rates helped us to understand why long-term bonds could be more profitable than sticking to short-term notes and reinvesting the proceeds. We introduced a specific method of profiting from long-term bonds , through the roll-down strategy , and demonstrated how this provides a hidden source of profits, a source appreciated by few investors.
We concluded our analysis with a brief overview of our best roll-down ideas. The issues that we strongly recommend, based on their ability to capture roll-down return, are listed below.
UBS: UBS 4.253% 23Mar2028 Corp (USD) and UBS 5.875% Perpetual Corp (SGD)
Credit Suisse: CS 4.282% 09Jan2028 Corp (USD) and CS 5.625% Perpetual Corp (SGD)
Oxley Holdings: OHLSP 5.700% 31Jan2022 Corp (SGD)
Declaration:
For specific disclosure, at the time of publication of this report, IFPL (via its connected and associated entities) has principal positions in OHLSP 6.375% 21Apr2021 Corp (USD), OHLSP 5.000% 05Nov2019 Corp (SGD) Retail and UBS 5.875% Perpetual Corp (SGD). The analyst who produces this report own none of the above mentioned securities.