

- We continue to recommend short-duration products, primarily due to the prevailing inverted yield curve environment.
- Floating rate instruments can also serve as short-duration alternatives, given the use of daily reference rates embedded in their coupon calculations.
- The HGIF Ultra Short Duration Bond Fund primarily uses floating rate instruments to keep its duration exposure light, while maintaining a high average credit quality.
- Risk-averse investors who are willing to take a small amount of extra risks while looking for a small yield pickup over traditional money market funds can consider this HSBC fund!
We generally continue to recommend shorter-duration fixed income products, based on our expectations for higher-for-longer interest rates as well as some normalisation of the yield curve (currently still inverted). The inverted yield curve, particularly for USTs, also points towards the highest levels of nominal yields being found only at the shortest tenors, especially those under 6 months (Chart 1).
Some of our recommendations over 2024 have included short-duration bond funds and money market funds. In this article, we take a deeper dive into the HGIF Ultra Short Duration Bond Fund, available with monthly-distributing share classes in USD and SGD. We think this fund should be a strong consideration for investors looking to achieve a yield enhancement over traditional money market funds while maintaining a low-risk profile.
Chart 1: Yield curve remains deeply inverted, highest nominal yields at the shortest tenors

About floating rate instruments
Before we dive into the fund, we briefly summarise what floating-rate instruments entail, given that a large part of the fund’s holdings (57% as of 30 September 2024) are in floating-rate instruments.
Floating-rate instruments have a different coupon structure compared to fixed-rate instruments. While actual coupon payments (i.e. cash payments given to bondholders) are paid quarterly, the exact coupon percentage will typically be calculated based on a daily basis (e.g. using an average of reference rates across the period), followed by the addition of a pre-determined spread. Since the calculated coupon will adjust alongside market reference rates, this reduces the mark-to-market price impact. Hence, floating-rate instruments usually have low duration profiles with little price sensitivity to benchmark rate fluctuations.
However, the performance of such instruments will still be susceptible to changes in credit spreads. These floating rate instruments (especially those held by the fund) are typically issued by corporates, which will come with their respective credit profiles. If markets judge that a company’s credit profile has weakened, its bond prices could decline even if benchmark rates and coupons remain unchanged. This makes the HSBC fund’s approach of selecting high-quality credits important, as these credits and issuers will be less likely to suffer from widening spreads.
We summarise the two points above floating rate instruments usually have (i) less sensitivity to benchmark rate fluctuations, but (ii) will still be affected by changes in credit spreads. This is clear if we compare two similar indices which focus on investment-grade USD-denominated bonds: Bloomberg US Corporate 0-5 Year Index, and Bloomberg US FRN < 5 Years Index (Chart 2).
- In 1Q20, both indices dropped by similar extents in 1Q20 (COVID) due to widening corporate IG spreads. Both indices also declined similarly in 2008 (GFC) due to widening spreads even though we excluded this from the chart for clarity.
- In the following Fed hike cycle (which started in early 2022), the FRN Index saw a much more stable performance compared to the US Corporate Index’s declines. This showcases the former’s significantly lesser duration exposure.
(Note: The former Bloomberg US Corporate Index only includes fixed-rate bonds, while the latter Bloomberg US FRN Index refers to an index of only floating-rate notes (FRNs), which have maturities of 4.999 years and under.)
Chart 2: FRN Index has been more resilient to a rising-rates environment, but is still affected by widening spreads

Fund objective
The HGIF Ultra Short Duration Bond Fund aims to achieve a combination of short-term capital growth and income by investing in bonds and money market instruments. The target level of distributions from its PM2 share classes is not fixed at a specific number; instead, it will depend on the underlying portfolio yield as HSBC seeks to make distributions sustainable.
The fund – in line with the ‘ultra short’ in its name - targets an effective duration of up to 0.5 years, with a duration typically ranging from 0.3 years to 0.5 years. We note that it does not have restrictions on its maturity, which could go well over 0.5 years due to the substantial use of floating rate instruments. However, investors should rest assured that the portfolio’s duration will generally remain low, and we do not expect major NAV moves arising from fluctuating benchmark rates.
The fund also maintains a high-quality tilt. Bonds must be investment-grade rated at the time of purchase, and the fund will maintain an average rating of at least A-. In terms of currency, it will primarily invest in USD returns, though it is allowed to invest in non-USD bonds with a full hedge back to USD; the fund managers have shared that the latter helps to add a few basis points of yield to the fund.
Latest portfolio metrics (Oct 2024)
(Data below as of 31 October 2024 [factsheet] unless otherwise stated.)
The fund maintains a well-diversified portfolio of 791 holdings (excluding cash), including around 300 issuers. The fund’s geographical exposure is well-diversified - while the US accounts for 55% of the fund’s allocation, this is fairly typical of the broader bonds universe (Chart 3). Sectorally, the fund’s largest allocation is into banking (42%), though this is again mostly a function of the bonds universe, as banking companies are typically the largest issuers of short-term paper (Chart 4).
(Note: While the fund’s geographical allocation is just 55% to the US, its FX exposure was 99.8% to the USD as of 31 October 2024, in line with its FX mandate stated above.)
In addition, its portfolio remains high in credit quality, with a majority of its holdings rated investment-grade – this is expected considering the fund’s mandate and objective highlighted above. For instance, its largest allocation is to credits rated A (44%), with only a very small allocation to unrated securities (0.02%) (Chart 5), suggesting its average credit rating likely lies around the A region. We think this commitment to maintaining a high (average) credit quality is clear and underscores the fund’s suitability for more risk-averse investors.
The fund’s latest duration (option-adjusted) was reported at 0.49 years, while the average maturity of its holdings was 1.50 years. We think the large discrepancy between the duration and maturity could be due to the fund’s large allocation to floating-rate instruments (see section above on such floating-rate instruments), whose eventual yields may be very closely tied to short-term rates (e.g. overnight SOFR). For us, duration is generally our key focus – with its light duration profile (0.5 years), the fund should continue exhibiting limited sensitivity to benchmark rate fluctuations, resulting in smaller price or mark-to-market movements.
Finally, we look at the fund’s top 10 holdings to get a more concrete sense of what the fund primarily invests in (Table 1). Some of the themes highlighted above can be observed from these top holdings including (i) a large allocation to US and Financials names; (ii) a fairly high credit rating; and (iii) a large allocation to floating-rate instruments.
Summarising the above, we think investors in this HSBC fund can expect a well-diversified portfolio with fairly small credit and interest rate risks.
Chart 3: Over 50% of the fund is invested in US fixed income

Chart 4: Fund’s largest allocation is to banking names

Chart 5: Fund remains high in credit quality

Table 1: Top 10 holdings of the fund
| Issuer* | Geography** | Sector | Credit Rating (S/M/F)*** | Coupon (Fixed / Floating) | Maturity Date (Years to Maturity) | Weight |
| UnitedHealthGroup | US | Healthcare | A+ / A2 / A | Floating | 15 Jul 26 (1.7) | 1.71% |
| VMWare LLC | US | IT | BBB / - / BBB | Fixed | 15 May 25 (0.5) | 0.91% |
| JPMorgan Chase | US | Financials | AA- / Aa2 / AA | Floating | 29 Apr 26 (1.5) | 0.86% |
| Verizon Comm | US | Communications | BBB+ / Baa1 / A- | Floating | 20 Mar 26 (1.4) | 0.84% |
| EMD Finance LLC | Germany | Healthcare | A / A3 / - | Fixed | 19 Mar 25 (0.4) | 0.68% |
| Bank of Ireland | Ireland | Financials | BBB / A3 / BBB+ | Fixed | 16 Sep 26 (1.9) | 0.64% |
| PepsiCo Inc | US | Consumer Staples | - / - / - | Floating | 12 Nov 24 (0.0) | 0.63% |
| Met Life Global | US | Financials | AA- / Aa3 / AA- | Floating | 11 Jun 27 (2.6) | 0.63% |
| Caterpillar Financial | US | Industrials | A / A2 / A+ | Floating | 27 Feb 26 (1.3) | 0.63% |
| Toronto Dominion Bank | Canada | Financials | A- / A2 / AA- | Floating | 05 Apr 27 (2.4) | 0.62% |
| Summary | - | - | - | Average: 1.4y | Total: 8.15% | |
| Source: Fund factsheet (PC USD share class), iFAST compilations, iFAST estimates. Data as of 31 Oct 2024. *HSBC may not explicitly specify the ticker of each holding, but these are implied from its recent floating rates and/or its latest revealed top holdings as of September 2024. **Geography generally refers to the market where the issuer is listed or conducts its main business operations in. ***Withdrawn ratings represented as unrated. | ||||||
HSBC fund’s track record and peer comparison
We see this HSBC fund as a decent alternative to traditional money market funds, though it is technically not a money market fund itself. While both generally have very short duration profiles, the key difference lies in credit spreads – the HSBC fund takes on a little more spread-related risks with the potential upside of delivering stronger yields.
The fund has delivered a decent performance since its inception in 2021 (Chart 6). The chart shows that the fund has delivered stable and positive performances over time, about 13% so far (as of 5 Dec) translating to annualised returns of around 3.7%. In addition, it has managed to deliver slightly improved returns over a composite of money market funds we have selected (which returned closer to 12% non-annualised or 3.3% annualised).
However, we also highlight that the HSBC fund will technically be more ‘risky’ compared to traditional money market funds. We observe in Chart 6 that the HSBC fund saw negative performances in mid-2022, though this was limited and did not even cross -1%. In contrast, the money market funds we have highlighted in our previous articles typically see even lower drawdowns (less than 0.2%). We provide some summary metrics for the HSBC funds and some peers below, which underscores our point that (i) the HSBC fund has managed to deliver some performance uplifts over traditional money market funds; but (ii) this has come with slightly higher but still-manageable volatility (Table 2).
Looking ahead, we can estimate the net yields of the HSBC fund using its stated indicative yield-to-worst and its expense ratio. We estimate its net yields at around 4.99% (as of 31 October), just slightly higher than its money market fund peers on our platform which are generally around the 4.5% area. Once again, this highlights the potential for this HSBC fund to potentially deliver enhanced yields compared to traditional money market funds.
Chart 6: Performance comparison (HSBC against MMF peers)
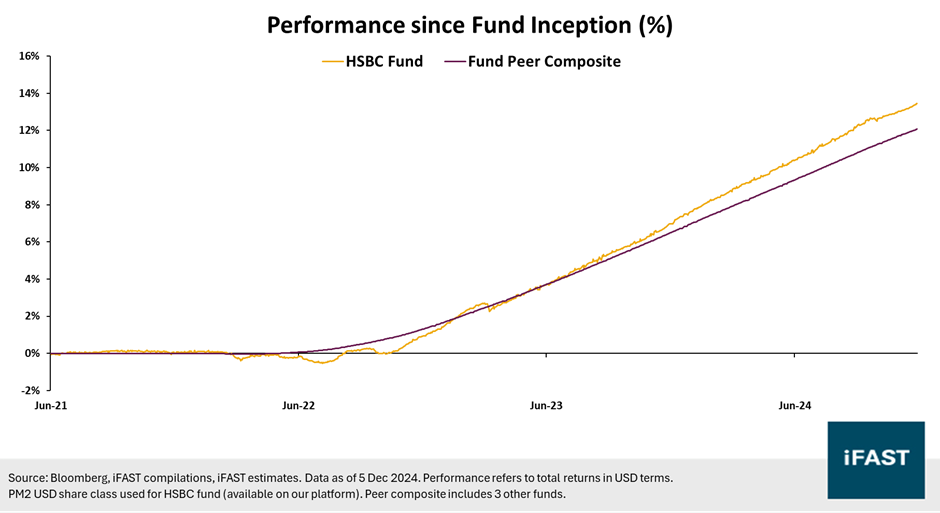
Table 2: Fund metrics against peers
| Metrics since HSBC Fund Inception | HSBC Fund | Fund Peer Composite |
| Performance (annualised) | 3.70% | 3.30% |
| Maximum Drawdown | -0.70% | -0.10% |
| Volatility | 0.80% | 0.20% |
| Downside Volatility | 0.30% | 0.04% |
| Source: Bloomberg, iFAST compilations, iFAST estimates. Data as of 5 Dec 2024, starting in June 2021 (HSBC fund inception). Performance refers to total returns in USD terms. PM2 USD share class used for HSBC fund (available on our platform). Peer composite includes 3 other funds. | ||
Who should consider this HSBC fund?
We think this HSBC fund is suited for investors who are looking for a potentially higher-yielding alternative to traditional money market funds. Higher potential yields do come with slightly higher volatility and credit risks, however, though we think these remain manageable, especially considering its track record and its overall portfolio positioning towards only high-quality credits.
This fund is available in two share classes: HGIF – Ultra Short Duration Bond PM2 USD, and HGIF – Ultra Short Duration Bond PM3H SGD. Both are distributing share classes: the former offers a monthly distribution last reported at 5.45% annualised in USD terms, while the latter also offers a monthly distribution last reported at 3.51% annualised in SGD terms.
Declaration: For specific disclosure, at the time of publication of this report, IFPL (via its connected and associated entities) hold a NIL position in the abovementioned securities.
All materials and contents found in this site are strictly for general circulation and informational purposes only and should not be considered as an offer, or solicitation, to deal in any of the funds or products found/identified in this site. While iFAST Financial Pte Ltd ("IFPL") has tried to provide accurate and timely information, there may be inadvertent delays, omissions, technical or factual inaccuracies and typographical errors. Any opinion or estimate contained in this report is made on a general basis and neither IFPL nor any of its servants or agents have given any consideration to nor have they or any of them made any investigation of the investment objective, financial situation or particular need of any user or reader, any specific person or group of persons. You should consider carefully if the products you are going to purchase are suitable for your investment objective, investment experience, risk tolerance and other personal circumstances. If you are uncertain about the suitability of the investment product, please seek advice from a financial adviser, before making a decision to purchase the investment product. Past performance is not indicative of future performance. The value of the investment products and the income from them may fall as well as rise. Opinions expressed herein are subject to change without notice. In respect of any matters arising from, or in connection with the said research analyses or research reports, recipients of the report are to contact IFPL at 10 Collyer Quay, #26-01 Ocean Financial Centre Building, Singapore 049315, or by telephone at +65 6557 2853. Where the report contains research analyses or research reports from a foreign research house and if the recipient of such research analyses or research reports is not an accredited investor, expert investor, institutional investor or an ex-accredited investor, IFPL accepts legal responsibility for the contents of such analyses or reports to such persons only to the extent as required by law. Please note that only certain security(ies) herein are available to all investors, while the rest are only available for certain persons to invest in, such as Accredited Investors (as defined in the Securities and Futures Act) or one who invests at least S$200,000 (or its equivalent currency) per transaction. To qualify as an Accredited Investor, one needs to submit a declaration form and certain relevant supporting documents, according to iFAST’s prevailing policies and procedures.
Please read our full disclaimers on the website at ( https://secure.fundsupermart.com/fsmone/policies/328125/investment-account-terms-&-conditions).
iFAST Financial Pte Ltd (IFPL) (registered address: 10 Collyer Quay #26-01 Ocean Financial Centre Singapore 049315, Telephone: 6557 2000) holds the Financial Advisers Licence issued by the Monetary Authority of Singapore ('MAS') to conduct regulated activities of advising on securities, marketing of collective investment schemes and arranging of any contract of insurance in respect of life policies, other than a contract of reinsurance and the Capital Markets Services Licence issued by the MAS to conduct regulated activities of dealing in securities and providing custodial services for securities. While IFPL has made every effort to ensure the independence of the report's contents, IFPL's nature of business is such that IFPL and its connected and associated entities together with their respective directors, officers and staff may be involved in providing dealing or investment-related services in the abovementioned securities, and have taken or may take positions in the securities mentioned in this report, and may also act as the principal for any buy or sell trades.