


-
The infrastructure sector is less subjected to the economy’s ups and downs. The services they provide – maintaining transport routes and telecom services, providing water and electricity supply – usually benefit from inelastic demand, regardless of the economic climate.
Most infrastructure companies have some form of inflation protection embedded into their contract structures, allowing them to benefit in the current inflationary environment.
Public policy support for infrastructure investment remains strong globally, with billions of dollars flowing into the sector.
The US Inflation Reduction Act, signed into law in August 2022 is the most significant climate legislation in US history and is going to be industry transformative. The global drive towards decarbonisation would be on full display for the next decade, creating a multitude of opportunities within the space.
We recommend investors to consider the FTGF ClearBridge Infrastructure Value Fund for exposure to the infrastructure sector. The fund focuses in global listed infrastructure such as electricity and water utilities, toll roads, airports, rail, and communications.
Inflationary pressures drove the investment narrative in 2022, and we expect these pressures to continue into 2023. In an inflationary and rising interest rate environment, the infrastructure sector is often turned to for its defensive and resilient return profile.
Not to mention, the infrastructure sector’s resilience would be on full display in 2023 even amidst the current challenging macro environment, as the dire need for infrastructure spending underpins growth for the next decade, and the first steps for meeting long-term climate and electrification goals are now being taken.
A broad universe - breaking down the infrastructure sector
Infrastructure is critical, as these physical assets provide an essential service to society. Simply put, these are the services we use and interact with every single day. For instance, we use gas, water, and electricity to carry out our daily activities, and we also use airports and roads, to get from location to location. As such, infrastructure refers to the basic physical and organisational structures and facilities needed for the operation of a society.
Seeing that the infrastructure sector comprises a wide range of assets, it can be broken down into a number of subsectors depending on the classification system or framework being used. We have broken it down into these four subsectors below:
1) Transportation infrastructure: Covers the construction and maintenance of highways, bridges, airports, ports, and mass transit systems.
2) Energy infrastructure: Covers the construction and operation of power generation and distribution systems, as well as oil and gas pipelines.
3) Water and sewage infrastructure: Covers the construction and operation of water treatment facilities, water distribution systems, and sewage treatment plants.
4) Communication infrastructure: Covers the construction and operation of telecommunications networks, including landline phones, mobile phones, and the internet.
Infrastructure assets can also be categorised into two main buckets: regulated assets and user-pay assets (Table 1). Regulated assets typically act as a good hedge for inflation, while user-pay assets are more dependent on market demand. When an economy grows and develops, the demand for user-pay assets would likely grow as well.
Table 1: General overview of the differences between regulated assets and user-pay assets
|
|
Regulated assets |
User-pay assets |
|
Definition |
Assets subject to government price controls and regulation |
Assets funded by users paying directly for the goods or services provided |
|
Pricing |
Regulator often sets prices or profit margins based on costs. Periodically takes into account inflation |
Prices set by owner or operator often based on market demand |
|
Stability |
Relatively stable revenue profile over time |
Revenue can be more volatile based on usage or changes in demand |
|
Inflation protection |
Revenues often linked to inflation |
Some have escalation factors built into their agreements |
|
Examples |
Utilities, telecommunications |
Toll roads, bridges, tunnels, mass transit systems |
Infrastructure earnings tend to be better protected against inflation
In the midst of a sell-off across global equities and bond markets in 2022, the infrastructure sector stands out with its display of resilience (Figure 1). To understand why the infrastructure sector is resilient, we look to the fact that they provide essential, non-discretionary services, which benefit from inelastic demand. The services continue to be used through periods of economic downturns, enabling them to produce steady cash flows.
Figure 1: Global Infrastructure, equities and bond performance in 2022
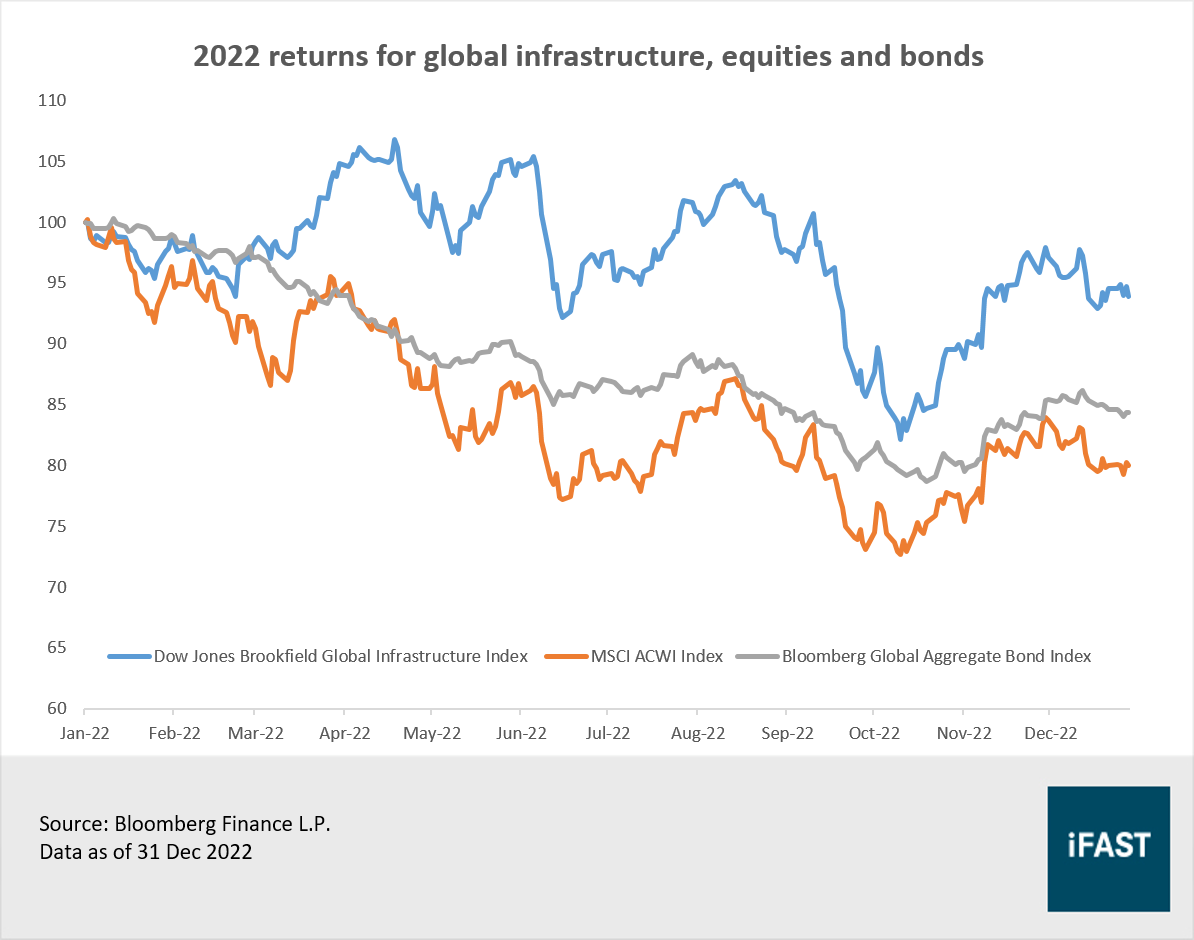
Moreover, in an inflationary environment that we are currently in right now, revenue streams from infrastructure assets can increase along with the general increase in prices, providing a hedge against inflation. As after all, many infrastructure business feature pricing structures that have an explicit inflation-linked pricing mechanism.
For instance, toll road operator Transurban Group, which owns and operates toll roads in North America and Australia have embedded CPI escalation across 68% of its revenues with quarterly to annual toll price increases generally linked to inflation. Additionally, most power and utility assets (regulated assets) link their costs and prices to inflation through regulations, concession agreements or contracts, allowing them to pass higher expenses through to end-users.
Besides, the infrastructure sector tends to have high barriers to entry, requiring a high level of initial capital investment. This acts as a significant impediment to potential competitors entering the market. Companies are often monopolies, or operate in an oligopoly market structure, with contracts with the local governments also tending to be on a longer term basis. Taken together, all these factors help drive earnings growth for the infrastructure sector (Figure 2).
Figure 2: Earnings for the infrastructure sector is growing
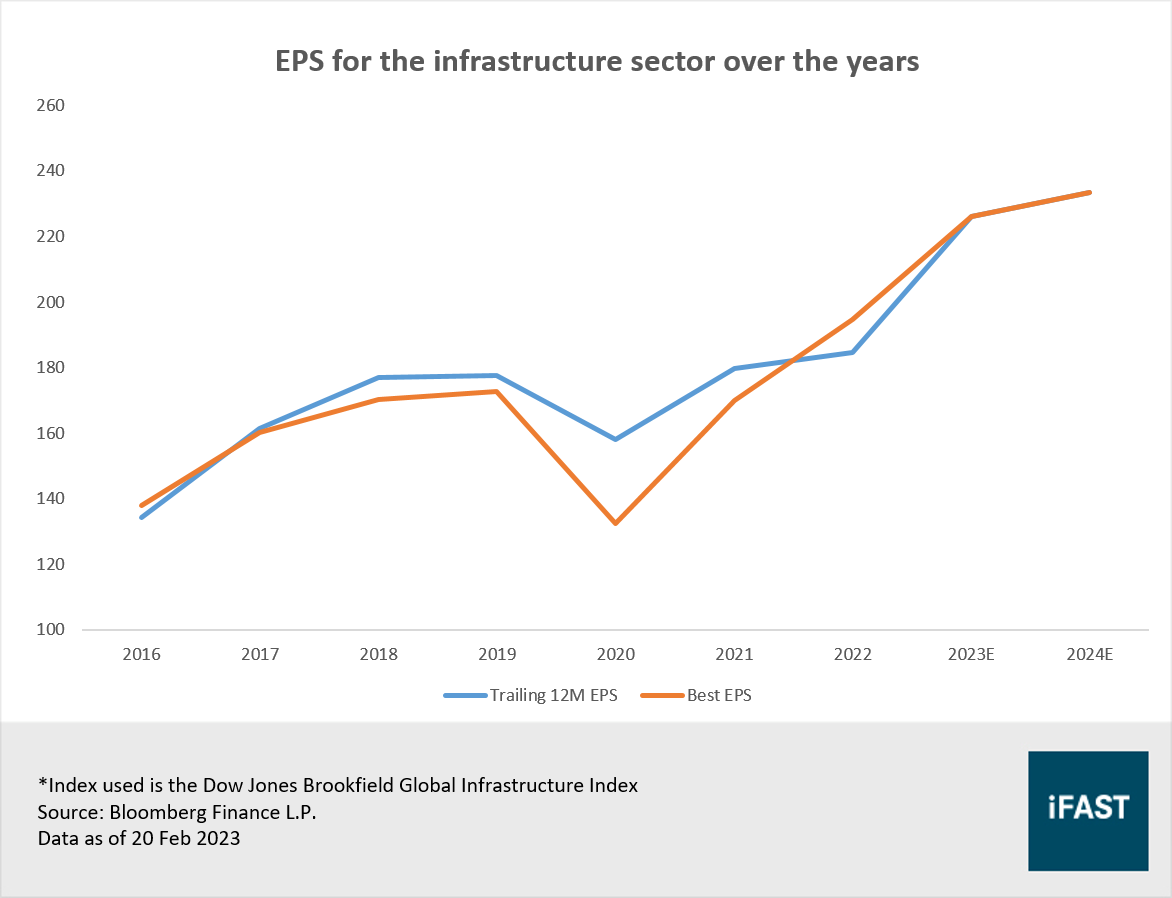
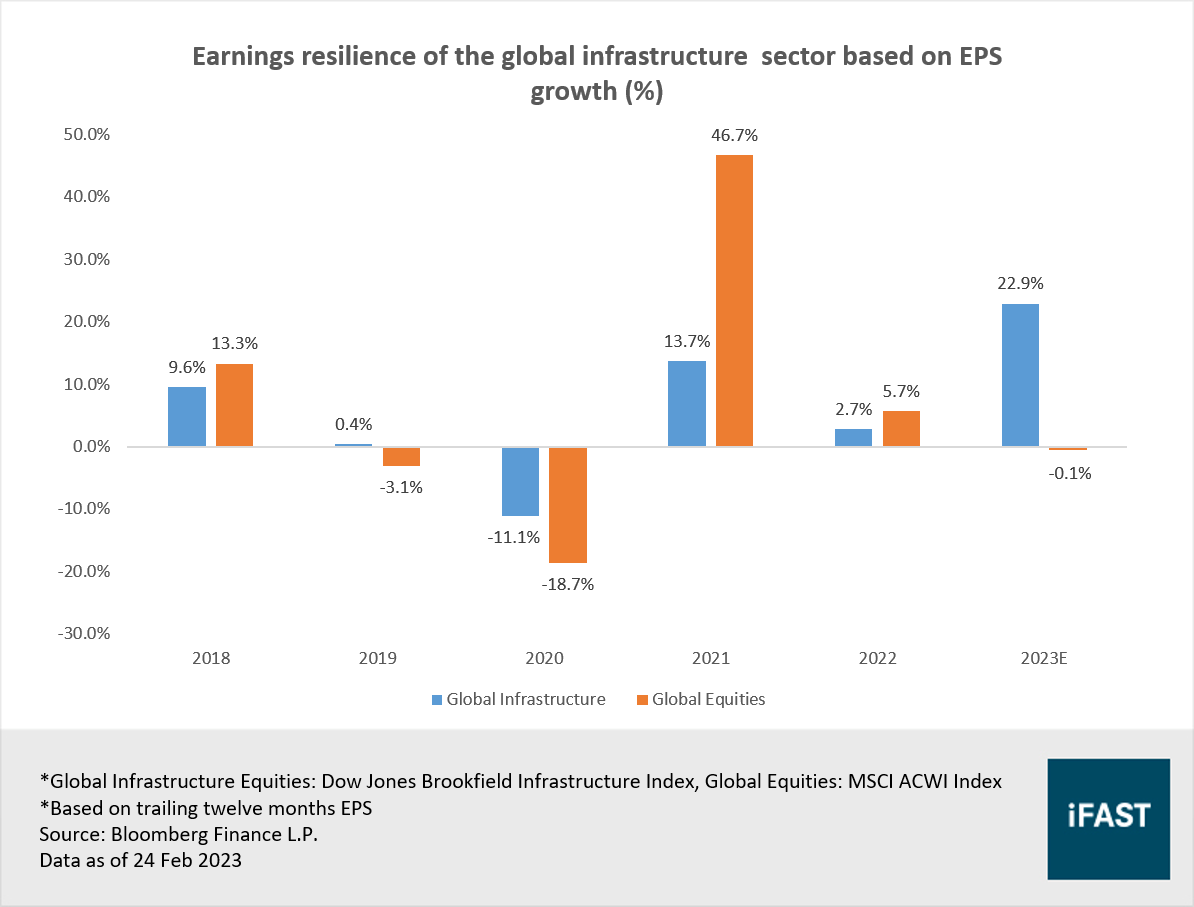
Looking ahead, infrastructure earnings are likely to be resilient, and outpace global earnings especially in periods of market sell-downs, as global equity earnings are set to decelerate while infrastructure maintains its strong growth (Figure 3). Moreover, we think that current earnings estimates for global equities, with a slight earnings decline are being overly optimistic given the mounting economic risks.
Figure 3: Global Infrastructure earnings growth more resilient and to outpace global equities in 2023
Riding the wave of massive policy support
The infrastructure sector is set to benefit from massive policy support. There is an urgent need to replace and upgrade ageing infrastructure. According to the 2021 report by the American Society of Civil Engineers, much of the local infrastructure in the US has a rating of C to D, meaning it is in urgent need of being replaced or upgraded in the next few decades.
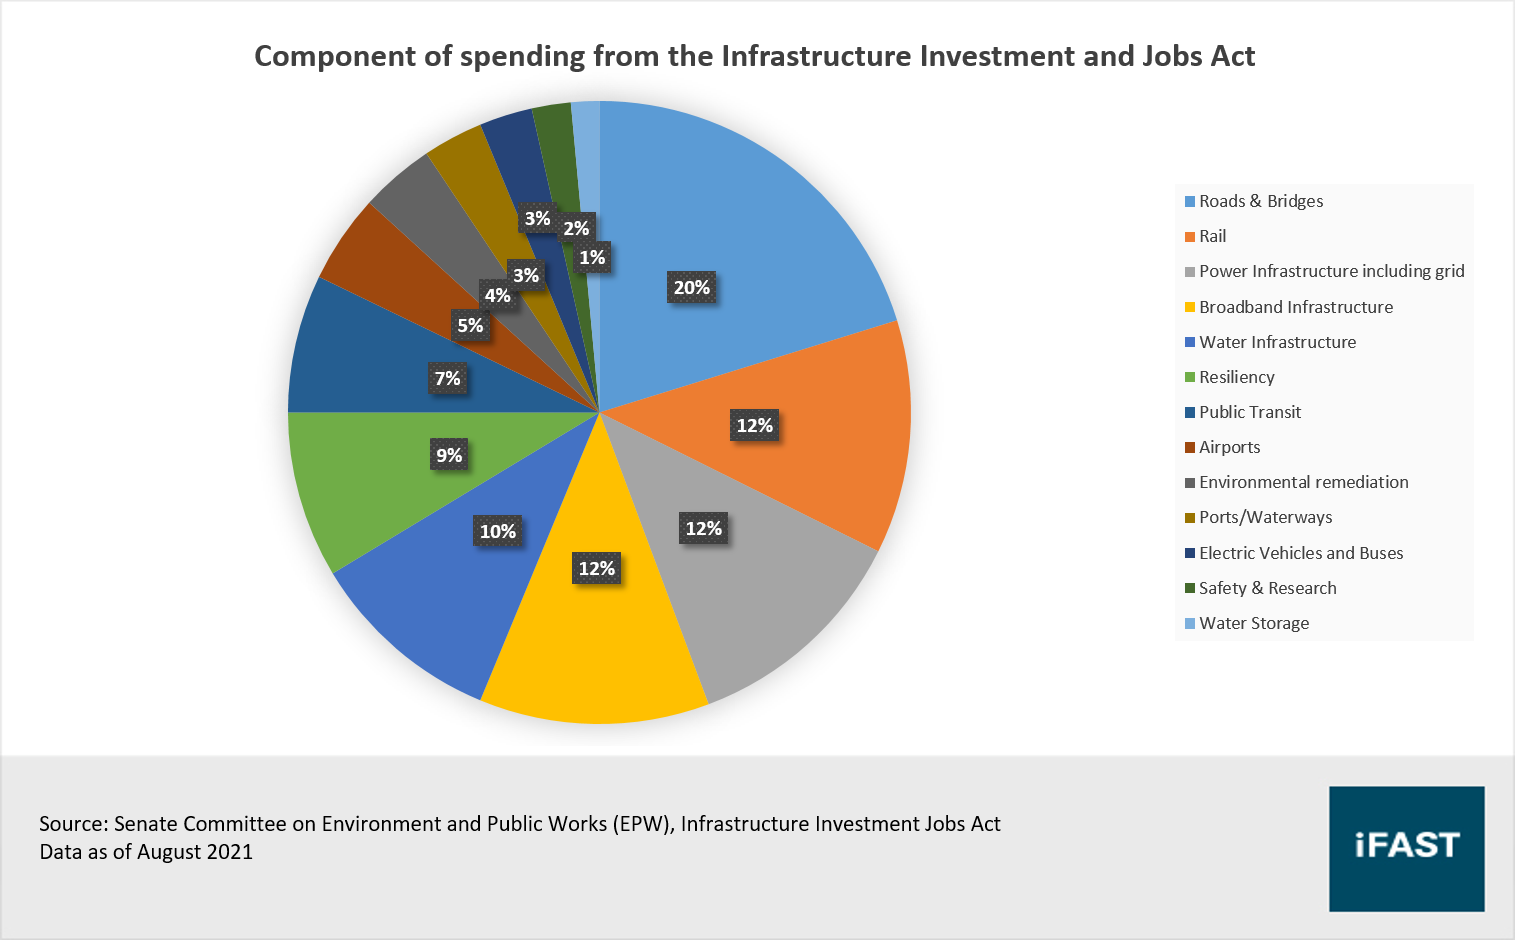
On 5 November 2021, Congress passed a bipartisan infrastructure bill known as the Infrastructure Investment and Jobs Act (IIJA) to modernise the country’s infrastructure and to create jobs. Funding from the IIJA is expansive in its reach, addressing energy and power infrastructure, access to broadband internet, water infrastructure, and more. The Act totals USD 1.2 trillion over the next decade, USD 550 billion of which would be for new federal spending that will be allocated over the next five 5 years (Figure 4).
Figure 4: Allocation of the USD 550 billion of new federal spending
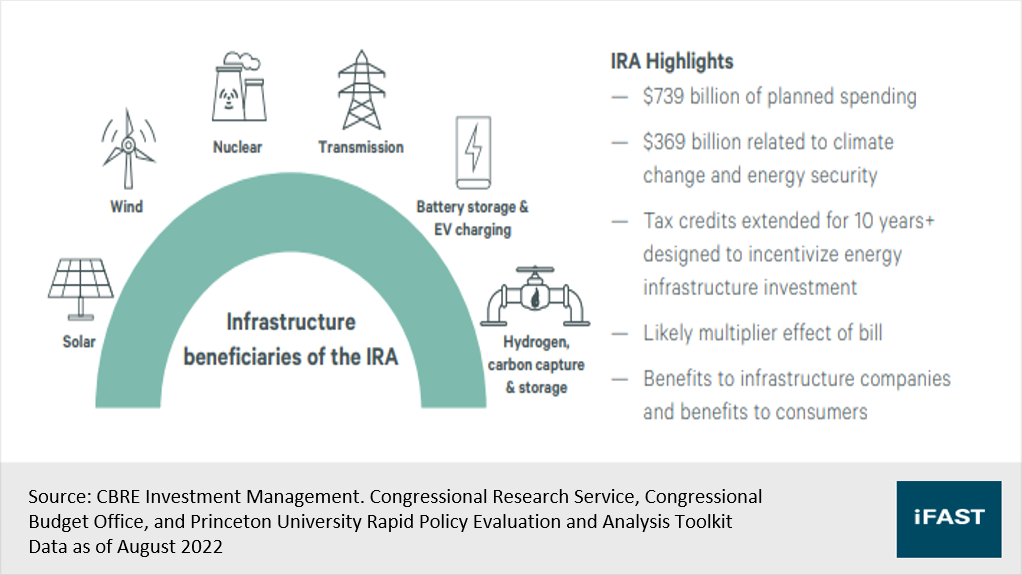
Moreover, the US Inflation Reduction Act (IRA) that was signed into law in August 2022 is the most significant climate legislation in US history. It commits more than USD 739 billion in planned spending and USD 369 billion to subsidies and tax credit over a decade to encourage decarbonisation and cleaner energy, including measures to support the development of hydrogen as a fuel source (Figure 5). These measures will support further investment and drive growth in renewable utilities.
Figure 5: Infrastructure is at the heart of the Inflation Reduction Act
The push for decarbonisation is accelerating, and there is no stopping this transition anytime soon given the environmental effects of fossil fuels (Figure 6). Not to mention, the Russia-Ukraine war also reinforced the importance of energy independence and security, further driving this shift towards renewables.
Figure 6: Three decades of renewable power investment ahead
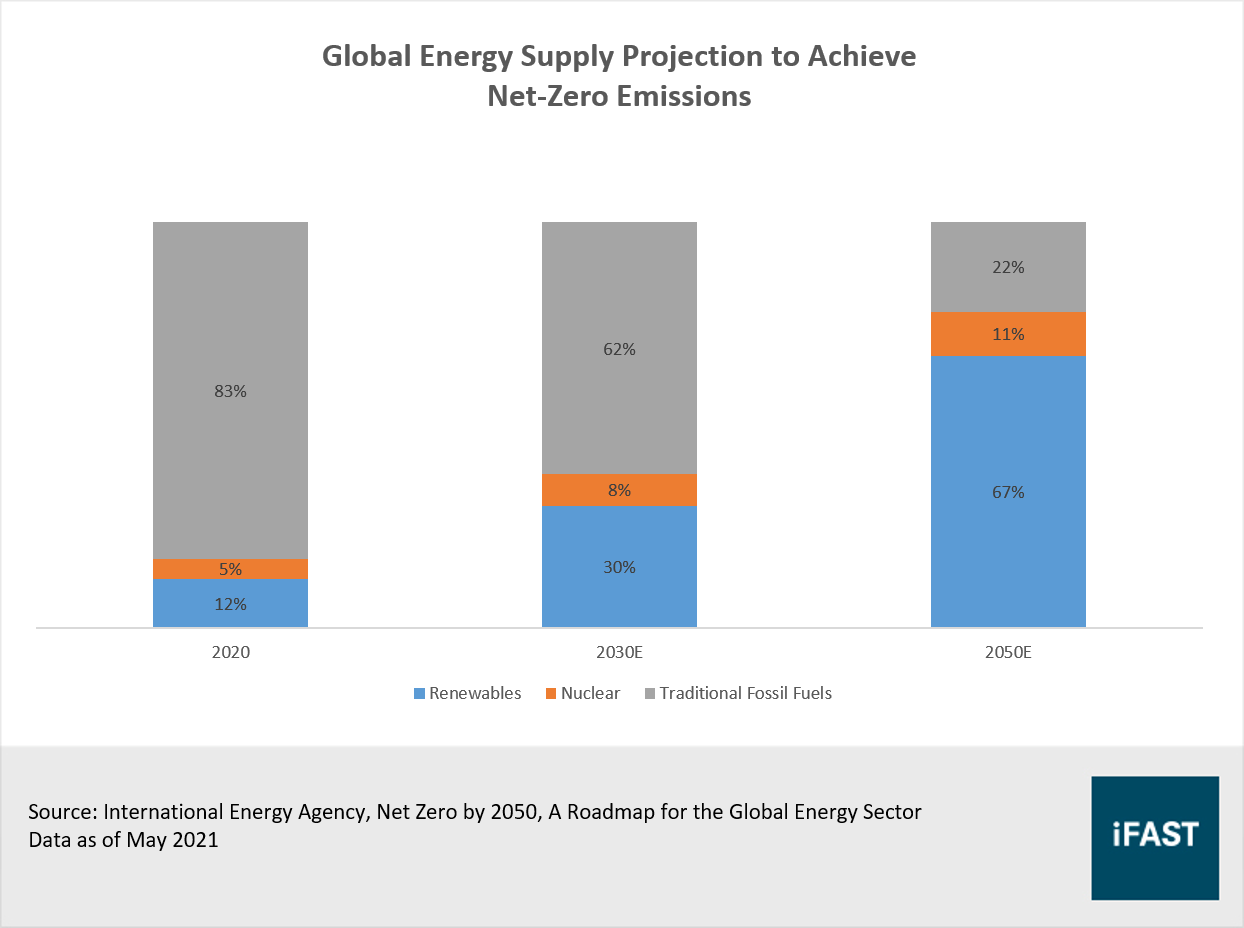
Overtime, this enhanced focus on energy security and sustainability will emerge as an increasingly important driver of infrastructure investment, and benefit companies within this space. We expect this trend to be secular, not cyclical in nature and could translate into higher prospective earnings growth rates for decades to come.
Key investment risks
Political and regulatory risks: Infrastructure assets are essential to the effective functioning of society, and governments may maintain some control and regulate them. In the most extreme cases, governments can nationalise assets below their market value, with this risk being more evident in emerging markets.
Interest rate risk: Infrastructure companies often have high levels of capital expenditure, and thus debt levels. Depending on the level of leverage and the debt structure, infrastructure assets can be exposed to interest rate volatility or refinancing risk. If not hedged, interest costs may increase, reducing operating cash flow levels.
An investment opportunity for the next decade
Equity markets are likely to remain volatile in 2023, and we see a bright spot in the infrastructure sector given that the nature of its business and its business models offer continued strength (relatively inelastic demand, inflation-protection, resilient earnings).
Beyond this, there are many powerful growth drivers for the infrastructure sector ahead. The sector remains well positioned to benefit from several long-term secular trends, such as the ongoing drive to modernise and upgrade infrastructure, and the global drive to decarbonise the entire economy.
For valuations, we look at the forward EV/EBITDA ratio seeing that the price-to-earnings (P/E) ratio may not be the best choice for valuing infrastructure companies due to their often high levels of capital expenditure and depreciation, which can impact their earnings. Currently, the infrastructure sector is trading at a discount to its historical average.
Figure 7: Valuations of the infrastructure sector
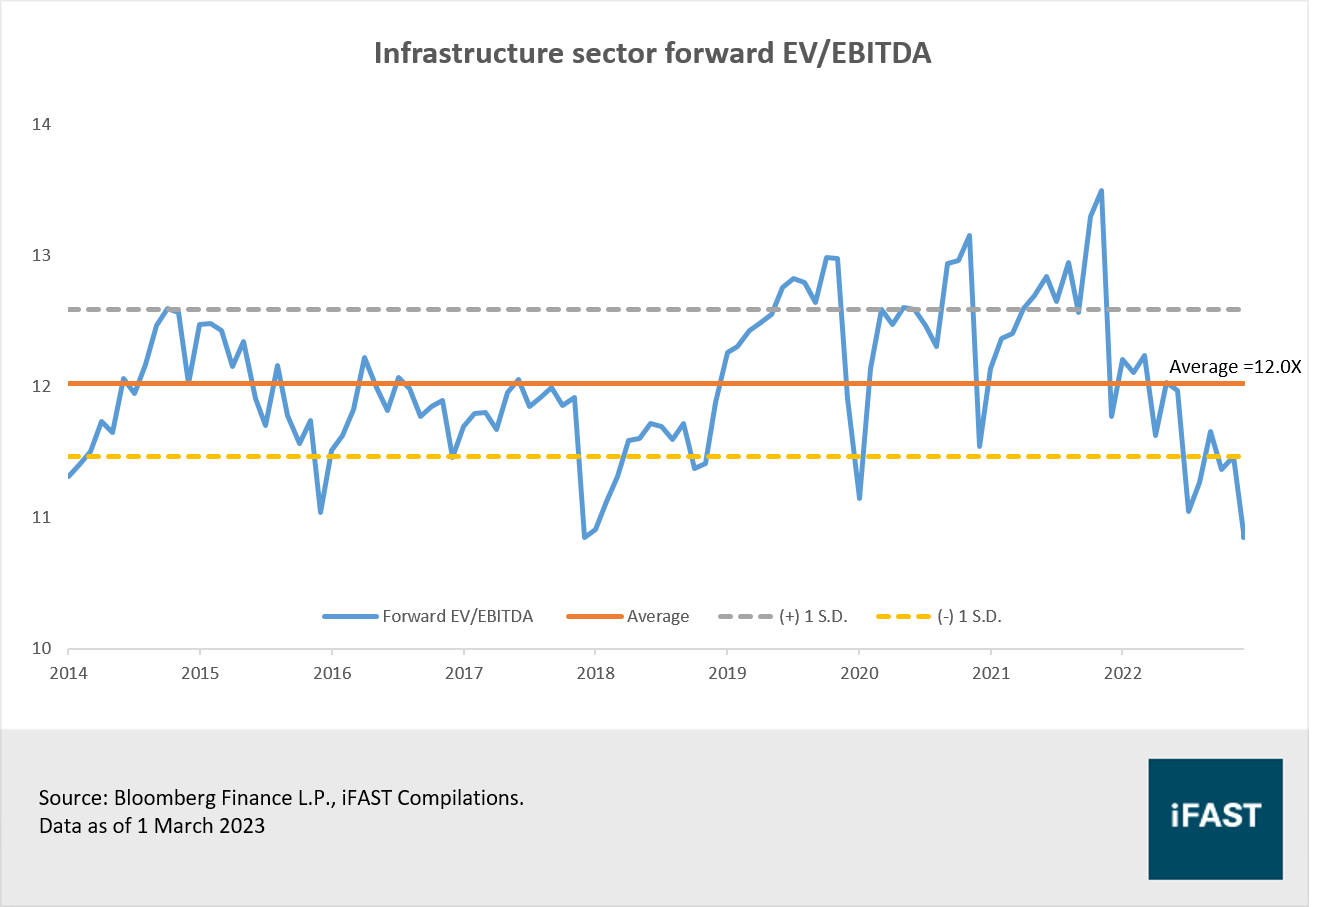
Table 2: EBITDA growth of the global infrastructure sector
|
|
2021 |
2022 |
2023E |
2024E |
|
Forward EV/EBITDA |
13.3 |
11.4 |
10.9 |
10.6 |
|
Expected EBITDA growth (%) |
6.3% |
9.6% |
27.2% |
4.0% |
|
EBITDA per share (USD) |
433.4 |
474.9 |
604.2 |
628.1 |
|
Source: Bloomberg Finance; iFAST Estimates. Data as of 1 March 2023 |
||||
Investors looking for opportunities in the infrastructure sector can consider the FTGF ClearBridge Infrastructure Value Fund. The fund invests in a range of listed infrastructure assets including electricity, water utilities, toll roads, airports, rail and communications in both developed and emerging markets. It seeks out companies that offer predictable cash flows because of the long-term nature of their contracts, and benefit from inflation protection of cash flows or assets. The fund's 12-month yield is 5.60%, with the fund having an average yield of about 4.5% since inception.
Table 3: Comparison of Infrastructure Funds on our platforms with more than 3 years track record
|
|
3Y Annualised Return |
5Y Annualised Return |
Annualised Volatility |
Max Drawdown |
|
FTGF ClearBridge Infrastructure Value Fund |
3.56% |
8.38% |
22.63% |
-36.8% |
|
BNY Mellon Global Infrastructure Income Fund |
-4.96% |
N.A. |
30.97% |
-42.3% |
|
First Sentier Global Infrastructure Fund |
-1.48% |
4.47% |
23.68% |
-29.4% |
|
DWS Invest Global Infrastructure Fund |
0.61% |
5.90% |
25.49% |
-32.0% |
|
Returns in SGD terms Source: Morningstar, Bloomberg Finance L.P., iFAST Compilations Data as of 27 February 2023 |
||||
Figure 8: Sector allocation of the FTGF ClearBridge Infrastructure Value Fund
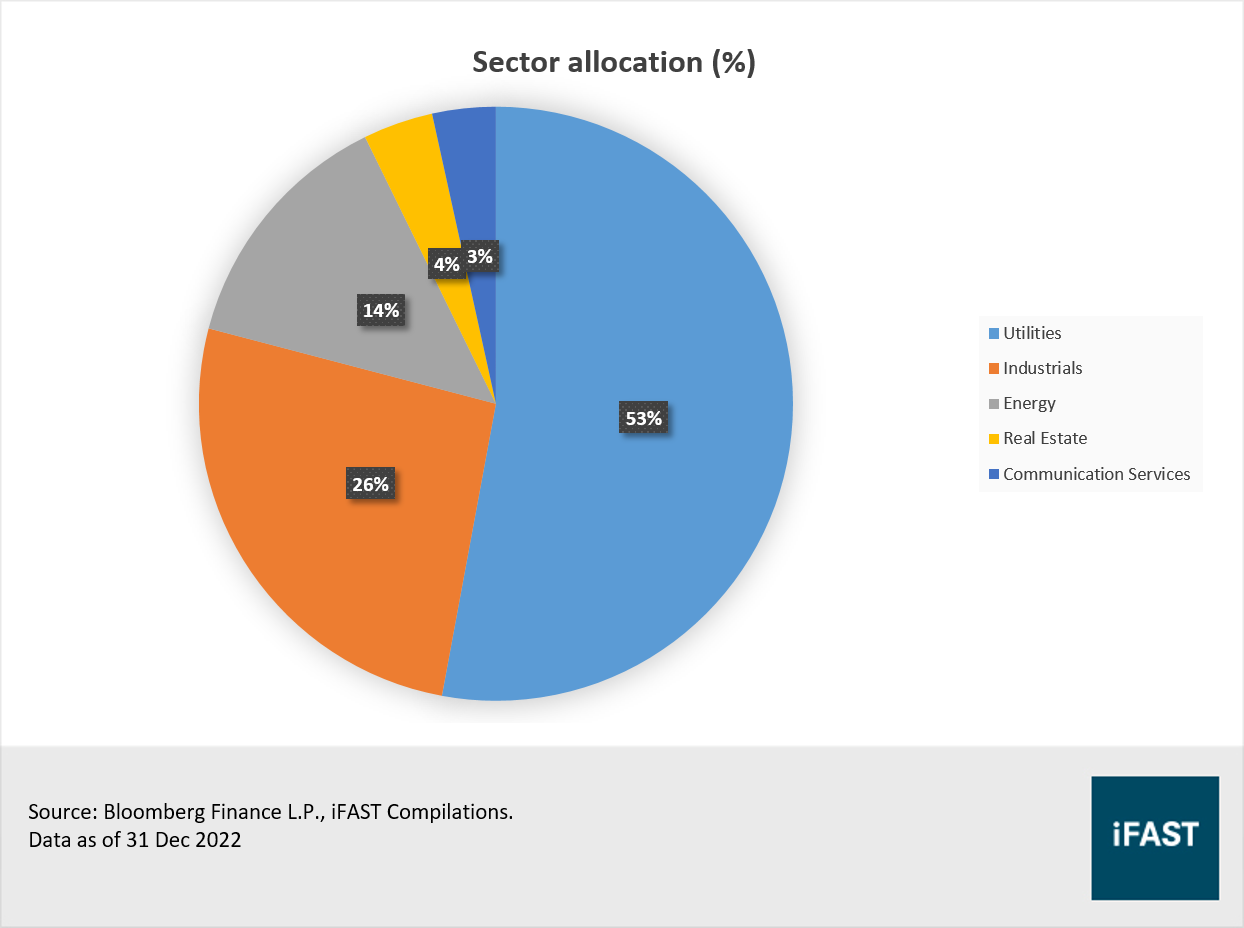
Table 4: Top 10 holdings of the FTGF ClearBridge Infrastructure Value Fund
|
|
Holdings Name |
Sector |
Weight (%) |
|
1. |
NextEra Energy Inc |
Utilities |
4.31 |
|
2. |
SSE plc |
Utilities |
4.03 |
|
3. |
East Japan Railway Co. |
Industrials |
3.99 |
|
4. |
Severn Trent Plc |
Utilities |
3.92 |
|
5. |
American Tower Corp |
Real Estate |
3.73 |
|
6. |
Constellation Energy Corp |
Utilities |
3.57 |
|
7. |
TC Energy Corp |
Energy |
3.47 |
|
8. |
Iberdrola SA |
Utilities |
3.46 |
|
9. |
EDP Group |
Utilities |
3.27 |
|
10. |
PPL Corporation |
Utilities |
3.23 |
|
Source: Legg Mason ClearBridge, iFAST Compilations Data as of 31 Dec 2022 |
|||
Declaration:
For specific disclosure, at the time of publication of this report, IFPL (via its connected and associated entities) and the analyst who produced this report hold a NIL position in the abovementioned securities.
All materials and contents found in this site are strictly for general circulation and informational purposes only and should not be considered as an offer, or solicitation, to deal in any of the funds or products found/identified in this site. While iFAST Financial Pte Ltd ("IFPL") has tried to provide accurate and timely information, there may be inadvertent delays, omissions, technical or factual inaccuracies and typographical errors. Any opinion or estimate contained in this report is made on a general basis and neither IFPL nor any of its servants or agents have given any consideration to nor have they or any of them made any investigation of the investment objective, financial situation or particular need of any user or reader, any specific person or group of persons. You should consider carefully if the products you are going to purchase are suitable for your investment objective, investment experience, risk tolerance and other personal circumstances. If you are uncertain about the suitability of the investment product, please seek advice from a financial adviser, before making a decision to purchase the investment product. Past performance is not indicative of future performance. The value of the investment products and the income from them may fall as well as rise. Opinions expressed herein are subject to change without notice. In respect of any matters arising from, or in connection with the said research analyses or research reports, recipients of the report are to contact IFPL at 10 Collyer Quay, #26-01 Ocean Financial Centre Building, Singapore 049315, or by telephone at +65 6557 2853. Where the report contains research analyses or research reports from a foreign research house and if the recipient of such research analyses or research reports is not an accredited investor, expert investor, institutional investor or an ex-accredited investor, IFPL accepts legal responsibility for the contents of such analyses or reports to such persons only to the extent as required by law. Please note that only certain security(ies) herein are available to all investors, while the rest are only available for certain persons to invest in, such as Accredited Investors (as defined in the Securities and Futures Act) or one who invests at least S$200,000 (or its equivalent currency) per transaction. To qualify as an Accredited Investor, one needs to submit a declaration form and certain relevant supporting documents, according to iFAST’s prevailing policies and procedures.
Please read our full disclaimers on the website at ( https://secure.fundsupermart.com/fsmone/policies/328125/investment-account-terms-&-conditions).
iFAST Financial Pte Ltd (IFPL) (registered address: 10 Collyer Quay #26-01 Ocean Financial Centre Singapore 049315, Telephone: 6557 2000) holds the Financial Advisers Licence issued by the Monetary Authority of Singapore ('MAS') to conduct regulated activities of advising on securities, marketing of collective investment schemes and arranging of any contract of insurance in respect of life policies, other than a contract of reinsurance and the Capital Markets Services Licence issued by the MAS to conduct regulated activities of dealing in securities and providing custodial services for securities. While IFPL has made every effort to ensure the independence of the report's contents, IFPL's nature of business is such that IFPL and its connected and associated entities together with their respective directors, officers and staff may be involved in providing dealing or investment-related services in the abovementioned securities, and have taken or may take positions in the securities mentioned in this report, and may also act as the principal for any buy or sell trades.