


- Equities to outperform Fixed Income in 2022
- Higher inflation over the next 2 years, rate hike cycle will start
- US equities are unattractive, remain underweight
- European equities to benefit from cyclical rebound in 2022
- Japan is an attractive market to play the global recovery
- HSI to Hit 35,000 By End 2023 With More than 40% Potential Upside
- Chinese equities likely bottomed, a contrarian bet in 2022
- Indian equities held back by extreme valuations; but long-term growth prospects remain bright
- Fixed Income challenged by the rising yield environment but selective segments in IG and HY are attractive
- Asian high yield offers attractive value
- Thematic opportunities to look out for in 2022
- US Semiconductors: Time to worry about a chip glut
- China Semiconductors: Beneficiary of Strong Policy Tailwind
- US Digital Economy: Long-Term Growth Intact, But Limited Upside
- China Digital Economy: Expect a Strong Turnaround In 2022
1. Equities to outperform Fixed Income in 2022
- Global economic recovery will continue into 2022. Rising vaccination rates worldwide and a re-opening of economies should continue to drive growth.
- Corporate earnings recovery should also continue in 2022. Earnings growth across major markets will remain positive despite some normalisation. Collectively, these factors provide a favourable environment for equities.
- Fixed income remains less attractive with a significant proportion of the market offering limited value. With the Fed looking increasingly likely to hike interest rates in 2022, fixed income assets could also be vulnerable to price declines.
- Equities are expected to outperform fixed income in 2022. Investors should stay overweight equities relative to fixed income.
Table 1: Upside Potential and Star Ratings across our equity market coverage
| Markets & Sectors | Upside Potential by End-2023 | 2022 Star Ratings (Scale of 1 - 5) | Rating |
| World | 11% | - | - |
| Developed Markets | 10% | - | - |
| Hong Kong | 49% | 4.5 | Very Attractive |
| China | 36% | 4.0 | Very Attractive |
| Asia ex Japan | 34% | 4.0 | Very Attractive |
| Emerging Markets | 29% | 4.0 | Very Attractive |
| South Korea | 29% | 4.0 | Very Attractive |
| Taiwan | 34% | 3.5 | Attractive |
| Russia | 30% | 3.5 | Attractive |
| Singapore | 29% | 3.5 | Attractive |
| Brazil | 72% | 3.0 | Attractive |
| Japan | 22% | 3.0 | Attractive |
| Malaysia | 20% | 3.0 | Attractive |
| Europe | 20% | 3.0 | Attractive |
| Indonesia | 15% | 3.0 | Attractive |
| US | 8% | 2.5 | Neutral |
| India | 6% | 2.5 | Neutral |
| Digital Economy | 3% | 2.5 | Neutral |
| Thailand | 2% | 2.5 | Neutral |
| Source: Bloomberg Finance L.P., iFAST estimates. Data as of 30 Nov 2021. | |||
2. Higher inflation over the next 2 years, rate hike cycle will start
- While the Fed sees recent inflation as ‘transitory’, it is taking longer than expected to dissipate. Furthermore, data suggests that US inflation is no longer concentrated in a few reopening categories, but spreading across stickier inflation components like wages and shelter.
- A growing number of companies are also raising prices as costs of labour and raw materials rise. We do not see inflation as ‘transitory’, and expect inflation to remain at elevated levels over the next two years.
- In line with that, we also expect the Fed to kick-start its rate hike cycle in 2022. Investors should stay away from longer-duration fixed income assets.
3. US equities are unattractive, remain underweight
- Given the strong rally in the US equity market, valuations of US equities remain unappealing (more than 1 SDEV above historical average), with the market already pricing in a lot of positives and leaving little room for risk.
- Earnings growth has likely peaked in 2021 and is expected to normalise. Earnings estimates for 2022 and 2023 do not justify current valuation levels.
- With valuations looking expensive, downside risks have also increased. A market pull-back or valuation contraction is possible, especially if earnings start to disappoint.
- We believe investors should expect low returns from US equities (potential upside of 8% by end-2023). Given its limited upside potential and the availability of better options elsewhere, we recommend investors to underweight the US.
Chart 1: S&P 500 Index Price and Forecasted EPS
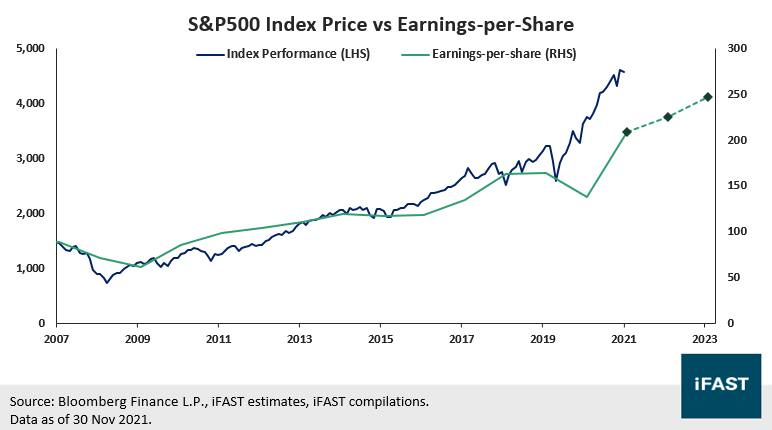
Table 2: Projections and Potential Upside for S&P 500 Index
| US (S&P500 Index) | FY20 | FY21 | FY22 | FY23 |
| PE Ratio (X) | 27.2 | 21.8 | 20.3 | 18.5 |
| Expected Earnings Growth YoY | -16% | 51% | 8% | 10% |
| Earnings Per Share (EPS) | 138 | 209 | 225 | 247 |
| Projected
Fair Price (based on fair P/E Ratio of 20.0X) |
- | - | - | 4,934 |
| Potential Upside from Today (%) | - | - | - | 8% |
| Source: Bloomberg Finance L.P., iFAST estimates. Data as of 30 Nov 2021. | ||||
4. European equities to benefit from cyclical rebound in 2022
- Europe could be a more attractive market to play the global economic recovery than the US, given its globalised revenue exposure (its share of international revenue exposure is almost 60%), pro-cyclical tilt (cyclical sectors contribute around 65% of index earnings) and relatively more dovish policies.
- Moreover, European equities have long been seen as a 'value' market that is heavily weighted towards banks and old-economy industries. A continued global economic recovery could be supportive of European equities.
- Despite a strong performance in 2021, valuations of European equities are still attractive, especially when compared to US equities.
- However, there are likely some near-term growth risks and volatility from Covid-19 and heightened restrictions in Europe.
- Recommended products:
Chart 2: Stoxx 600 Index Price and Forecasted EPS
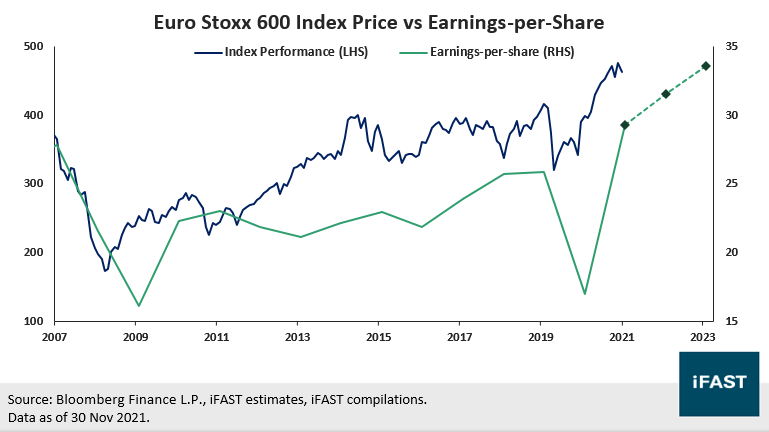
Table 3: Projections and Potential Upside for Stoxx 600 Index
| Europe (Stoxx 600 Index) | FY20 | FY21 | FY22 | FY23 |
| PE Ratio (X) | 23.5 | 15.8 | 14.7 | 13.8 |
| Expected Earnings Growth YoY | -34% | 73% | 8% | 7% |
| Earnings Per Share (EPS) | 17.0 | 29.3 | 31.5 | 33.6 |
| Projected
Fair Price (based on fair P/E Ratio of 16.5X) |
- | - | - | 556 |
| Potential Upside from Today (%) | - | - | - | 20% |
| Source: Bloomberg Finance L.P., iFAST estimates. Data as of 30 Nov 2021. | ||||
5. Japan is an attractive market to play the global recovery
- Japan’s equity market has disappointed in 2021, largely due to its slow vaccine roll-out. With vaccine supplies rapidly increasing, however, Japan’s vaccination rate has surged over 70%, paving the way for a more sustained economic reopening.
- With about 40% of revenues derived from overseas markets, Japan is typically very sensitive to global growth, and is therefore well-placed to benefit from the ongoing post-pandemic recovery. Market valuations are also attractive relative to the US.
- However, the Bank of Japan is likely to maintain its easy monetary policy, diverging from the US Fed. This means the JPY could depreciate further relative to the USD in 2022. Investors should opt for currency-hedged share classes where possible.
- Recommended products:
Chart 3: Nikkei 225 Index Price and Forecasted EPS
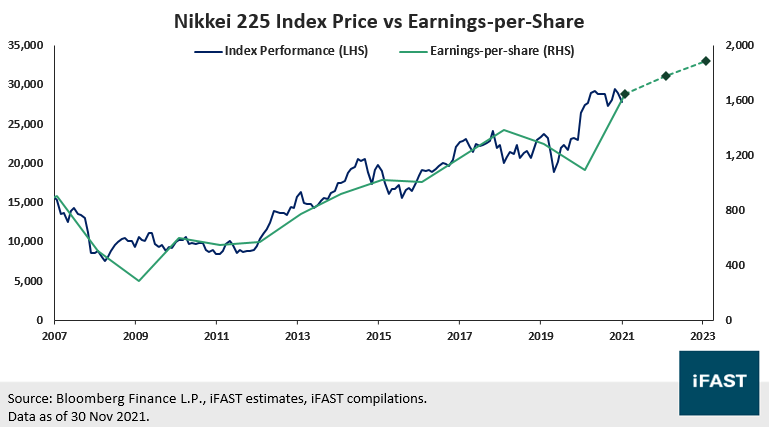
Table 4: Projections and Potential Upside for Nikkei 225 Index
| Japan (Nikkei 225 Index) | FY20 | FY21 | FY22 | FY23 |
| PE Ratio (X) | 25.1 | 16.9 | 15.6 | 14.7 |
| Expected Earnings Growth YoY | -15% | 51% | 8% | 6% |
| Earnings Per Share (EPS) | 1,092 | 1,648 | 1,778 | 1,889 |
| Projected
Fair Price (based on fair P/E Ratio of 18.0X) |
- | - | 32,000 | 34,000 |
| Potential Upside from Today (%) | - | - | - | 22% |
| Source: Bloomberg Finance L.P., iFAST estimates. Data as of 30 Nov 2021. | ||||
6. HSI to Hit 35,000 By End 2023 With More than 40% Potential Upside
- While the HSI has fallen, its fundamentals have not worsened. Earnings forecast of the Index has been revised upwards by 2.2%, and earnings growth for 2021 is estimated to remain in high double-digits (18.2%). Valuations have fully priced in pessimistic expectations and are trading at an extreme level, at a 16% discount to fair P/E.
- Major Chinese tech giants, which are key drivers for the HSI, are expected to generate considerable earnings growth in ’21 and ‘22. If earnings growth can meet market expectations, we expect valuations to re-rate higher. An improvement in earnings outlook for these companies can drive index equity performance.
- Earnings of Chinese Financials will accelerate. New loan growth is expected to rebound, and alongside potentially more credit stabilising policies, banks may see improved profitability, thereby providing additional support to index equity performance.
- The reform of the Hang Seng Index should be a positive development. The number of its components will increase to 80 by mid-2022 and the proportion of new economy stocks in HSI will keep rising.
- Hong Kong equities boast an attractive upside of 49% by end-2023, with a target price of 35,000.
- Recommended Product:
Chart 4: Hang Seng Index Price and Forecasted EPS
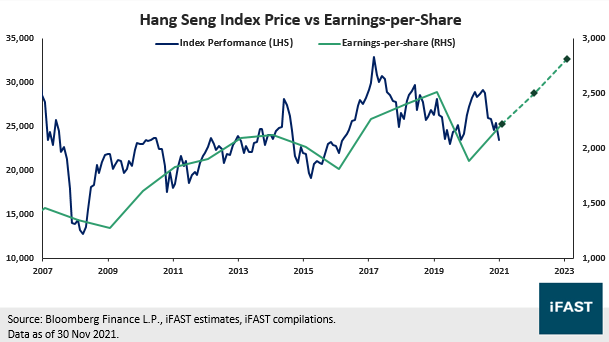
Table 5: Projections and Potential Upside for Hang Seng Index
| Hong Kong (Hang Seng Index) | FY20 | FY21 | FY22 | FY23 |
| PE Ratio (X) | 14.5 | 10.5 | 9.4 | 8.3 |
| Expected Earnings Growth YoY | - | 18% | 13% | 12% |
| Earnings Per Share (EPS) | 1,883 | 2,226 | 2,505 | 2,817 |
| Projected
Fair Price (based on fair P/E Ratio of 12.5X) |
- | - | - | 35,000 |
| Potential Upside from Today (%) | - | - | - | 49% |
| Source: Bloomberg Finance L.P., iFAST estimates. Data as of 30 Nov 2021. | ||||
7. Chinese equities likely bottomed, a contrarian bet in 2022
- We believe the growth slowdown in China has hit levels that policymakers can no longer ignore. While China is unlikely to engage in large-scale policy easing, we can expect to see some incremental loosening.
- The PBOC has already delivered some supportive policy fine-tuning for the property sector, by ensuring continued access to bank lending and mortgage approvals for healthy developers.
- China could roll out more supportive fiscal and monetary policies next year. We could see upward revisions in China’s 2022 GDP and earnings estimates, especially if regulatory pressures and the current power shortages ease.
- Chinese equities have likely bottomed, with the market already pricing in a lot of negative news. Valuations are attractive, especially since China is expected to see stronger earnings growth (estimated earnings growth of 16% YoY for 2022 and 2023) compared to many major equity markets.
- Opportunities also remain in areas that align with China’s strategic goals and benefit from supportive policies – China semiconductors, clean energy, and EVs.
- Recommended products:
Chart 5: MSCI China Index Price and Forecasted EPS
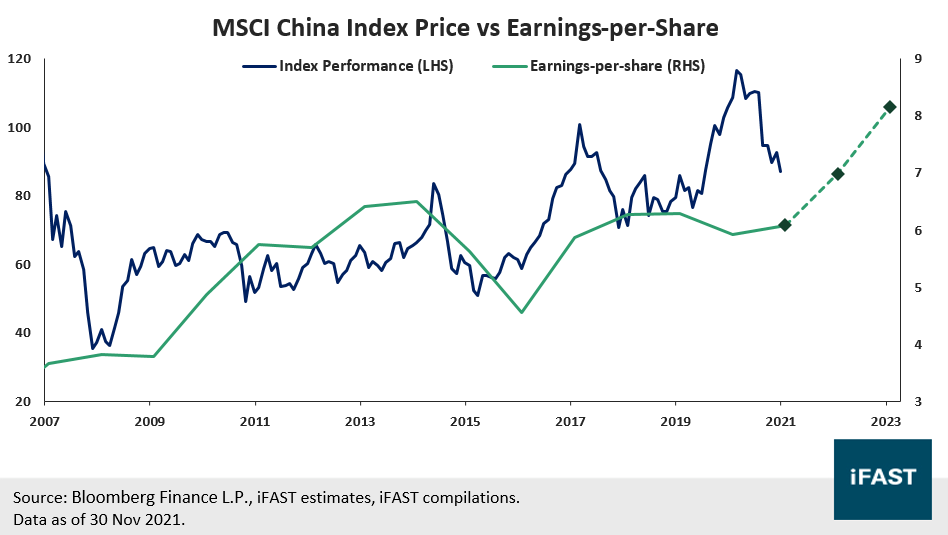
Table 6: Projections and Potential Upside for MSCI China Index
| China (MSCI China Index) | FY20 | FY21 | FY22 | FY23 |
| PE Ratio (X) | 18.3 | 14.3 | 12.5 | 10.7 |
| Expected Earnings Growth YoY | -6% | 3% | 15% | 17% |
| Earnings Per Share (EPS) | 5.9 | 6.1 | 7.0 | 8.2 |
| Projected
Fair Price (based on fair P/E Ratio of 14.5X) |
- | - | - | 118 |
| Potential Upside from Today (%) | - | - | - | 36% |
| Source: Bloomberg Finance L.P., iFAST estimates. Data as of 30 Nov 2021. | ||||
8. Indian equities held back by extreme valuations; but long-term growth prospects remain bright
- Macro data and earnings for Indian equities have rebounded amidst a backdrop of steadily decline in Covid-19 cases. However, many positives have already been baked into equity prices.
- Valuations are at an extreme, and are both expensive relative to history (close to 2 standard deviation above historical average) as well as to its EM peers (particularly Asian peers), which could pave the way for a near-term correction.
- India remains vulnerable to a correction from negative catalysts like elevated energy prices (India is a significant oil importer) and central bank rate hikes. At the same time, the recent strong performance in Indian equities is arguably tactical in nature (as investors shifted their exposure from China to India) and may unwind.
- We see the long-term growth potential in both the Indian economy and equity markets, particularly with India’s position as a key beneficiary of the global supply-chain relocation trend away from China. This arises partly due to ongoing US-China tensions, as well as China’s shift away from a manufacturing/export growth model. Alongside its massive consumer market, this multi-decade trend should serve as a structural tailwind for India’s economy and markets.
- However, with an elevated valuation and good news already largely priced in, we maintain our neutral stance on Indian equities. That said, we will be keeping a close eye on Indian equities and may revise our stance if valuations become more reasonable ahead.
- Recommended products:
Chart 6: BSE Sensex Index Price and Forecasted EPS
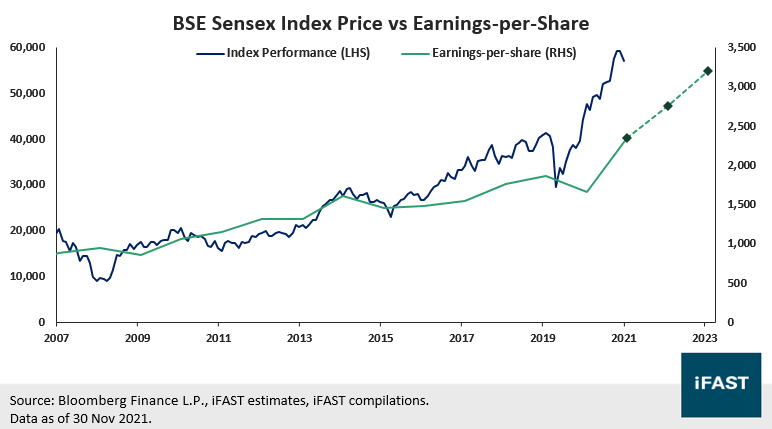
Table 7: Projections and Potential Upside for Sensex index
| India (BSE Sensex Index) | FY20 | FY21 | FY22 | FY23 |
| PE Ratio (X) | 28.7 | 24.4 | 20.7 | 17.9 |
| Expected Earnings Growth YoY | -11% | 41% | 18% | 16% |
| Earnings Per Share (EPS) | 1,663 | 2,340 | 2,758 | 3,195 |
| Projected
Fair Price (based on fair P/E Ratio of 19.0X) |
- | - | - | 60,703 |
| Potential Upside from Today (%) | - | - | - | 6% |
| Source: Bloomberg Finance L.P., iFAST estimates. Data as of 30 Nov 2021. | ||||
9. Fixed Income challenged by the rising yield environment but selective segments in IG and HY are attractive
- Fixed income will remain challenged on the asset class level, with a significant proportion of the fixed income market offering limited value. With the Fed set to raise interest rates in 2022, fixed income assets could also come under pressure.
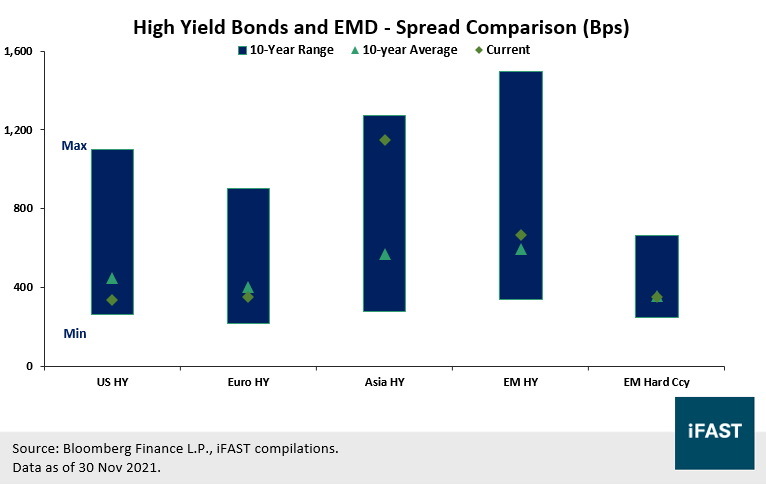
- Credit spreads in investment grade (IG) bonds are extremely tight, offering limited value. In the IG space, we prefer Asian IG bonds. While the spreads of high yield bonds are also narrow, they offer higher absolute yields, and are relatively more attractive. In the high yield space, we prefer Asian high yield bonds.
- Emerging market debt comes with high duration, which makes them very vulnerable to price declines when interest rates eventually increase. Valuations are slightly frothy and there is marginal room for spread compression (price upside).
- Investors looking to prepare their fixed income portfolios for higher rates could consider the following for diversification: inflation-hedged bonds, floating-rate bonds, unconstrained fixed income strategies, short-duration bonds, and Chinese government bonds.
Chart 7: Credit spread for Investment Grade bonds are near historical lows
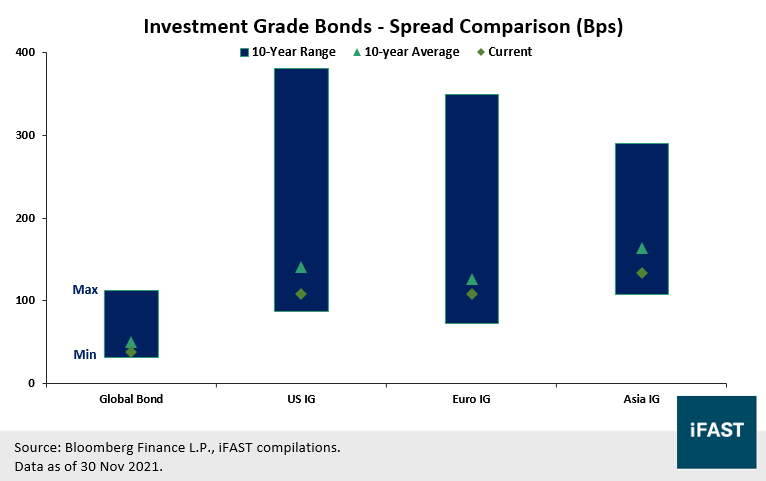
Chart 8: The same can be observed for High Yield bonds. However, the absolute yield is higher when compared to Investment Grade bonds.
10. Asian high yield offers attractive value
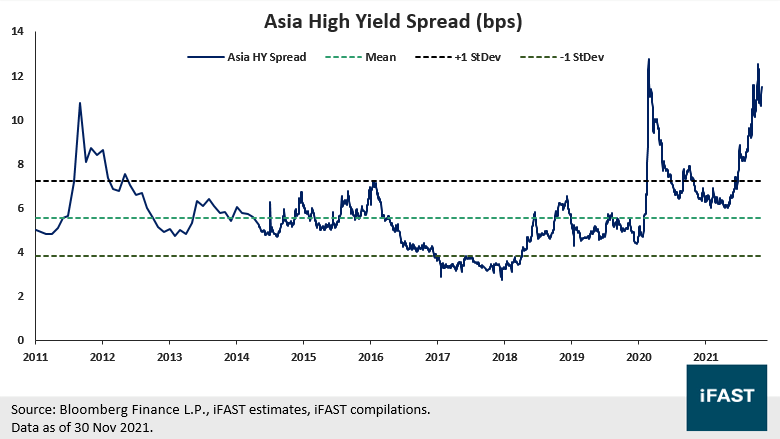
- Following the significant correction due to China’s crackdown on property developers, the Asian high yield segment is currently offering investors a yield of more than 11%, the highest in the fixed income space right now.
- The Chinese property sector is experiencing one of the toughest periods in history. While we do not rule out further defaults, especially amongst the smaller developers, we believe default risks should be manageable.
- The PBOC has already delivered some supportive policy fine-tuning for the property sector by ensuring continued access to bank lending and mortgage approvals for healthy developers.
- Current credit spreads seem to suggest a mass default in Chinese property sector, which we believe is an unlikely scenario. Credit fundamentals have generally improved, with most Chinese developers stepping up their deleveraging efforts.
- We believe a lot of negatives have already been priced in, with current valuations compensating for the risks that investors are taking in the sector. We recommend investors to opt for an active approach when investing in Asian high yield.
- Recommended products
Chart 9: Credit spread of Asia HY Bond Index near its all-time high
11. Thematic opportunities to look out for in 2022
- A continued global economic recovery could be supportive of value and cyclical sectors. Global financials appear well-positioned to benefit, especially with interest rates set to rise in 2022.
- Recommended products:
- In particular, Chinese financials stand out, with record-low valuations and attractive dividend yields. The sector is also now on a strong footing following years of deleveraging, and will also be a key beneficiary as China becomes the world’s largest economy.
- Recommended product:
- While the valuations of digital economy stocks are not attractive, investors should consider an allocation to the digital economy in their portfolios, especially as digital technologies are expected to drive massive transformations and disruptions in the coming years.
- Recommended product:
Table 8: Upside Potential and Star Ratings across our sector coverage
| Markets & Sectors | Upside Potential by End-2023 | 2022 Star Ratings (Scale of 1 - 5) | Rating |
| Financials | 17% | 3.5 | Attractive |
| Healthcare | 14% | 3.0 | Attractive |
| Semiconductors | -8% | 2.5 | Neutral |
| Source: Bloomberg Finance L.P., iFAST estimates. Data as of 30 Nov 2021. | |||
12. US Semiconductors: Time to worry about a chip glut
- A strong rally in 2020 and 2021 has pushed share prices of US chipmakers to record highs, driven by strong chip demand from both consumers and businesses. This has caused valuations to become relatively unattractive compared to their Chinese peers.
- While the industry is currently experiencing a chip shortage, there is a growing possibility of an inventory correction once supply chain issues resolve and demand normalises.
- Over-investment by major chipmakers and countries in the near-term could also lead to excess capacity in the future, which could trigger a down-cycle in the industry.
- While the long-term outlook remains positive, the current environment suggests that risks are tilted to the downside. Maintain 2.5 Stars “Neutral” rating on the sector.
Chart 10: PSE Semiconductor Index (SOX Index) Price and Forecasted EPS
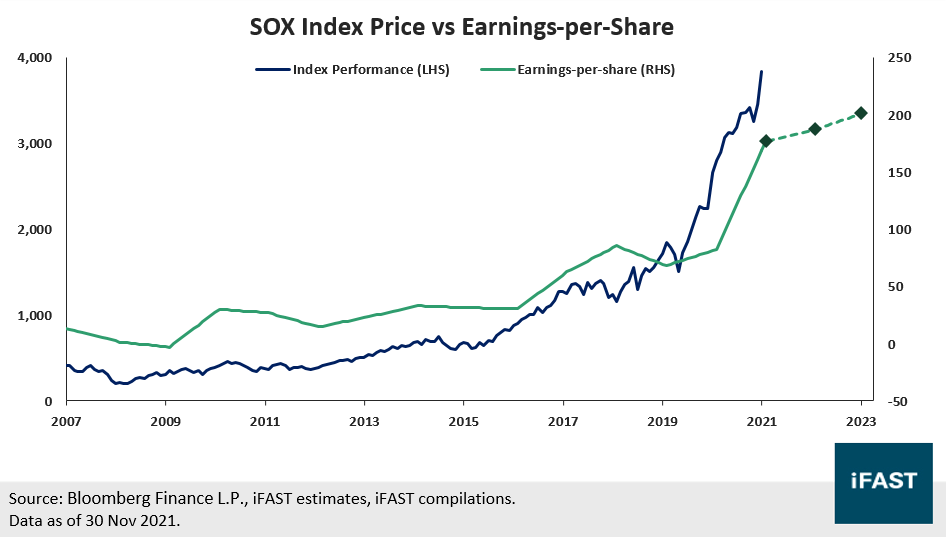
Table 9: Projections and Potential Upside for PSE Semiconductor Index
| US Semiconductors (SOX Index) | FY20 | FY21 | FY22 | FY23 |
| PE Ratio (X) | 34.0 | 21.7 | 20.5 | 18.9 |
| Expected Earnings Growth YoY | 21% | 115% | 5% | 8% |
| Earnings Per Share (EPS) | 82 | 177 | 187 | 202 |
| Projected
Fair Price (based on fair P/E Ratio of 20.0X) |
- | - | - | 4,046 |
| Potential Upside from Today (%) | - | - | - | 6% |
| Source: Bloomberg Finance L.P., iFAST estimates. Data as of 30 Nov 2021. | ||||
13. China Semiconductors: Beneficiary of strong policy tailwinds
- Despite facing US sanctions and a crackdown on the broader tech sector, Chinese chipmakers have held up well and are expected to deliver earnings growth of about 90% on aggregate in 2021.
- In a bid to achieve self-sufficiency, China has implemented several policies/initiatives to support the industry (e.g. tax incentives, national fund, nurturing talent and more).
- As of September 2021, domestic IC output is nearly double the level seen in 2018, a sign that China is making progress towards its goals. Expect continued growth as more capital is injected and productivity levels rise.
- Despite the near-term headwinds, the long-term outlook for China’s chip industry remains positive. In the near-term, valuations are more attractive compared to US chipmakers. Expect an upside potential of about 40% by 2023.
Table 10: Projections and Potential Upside for Global X China Semiconductor ETF (3191 HK)
| China Semiconductors (3191 HK) | FY20 | FY21 | FY22 | FY23 |
| PE Ratio (X) | 62.9 | 40.4 | 32.3 | 25.9 |
| Expected Earnings Growth YoY | - | 90% | 25% | 25% |
| Earnings Per Share (EPS) in CNY | 3.2 | 6.1 | 7.6 | 9.5 |
| Projected
Fair Price in HKD (based on fair P/E Ratio of 35.0X) |
- | - | - | 93 |
| Potential Upside from Today (%) | - | - | - | 35% |
| Source: Bloomberg Finance L.P., iFAST estimates. Data as of 30 Nov 2021. | ||||
14. US Digital Economy: Long-term growth intact, but limited upside
- US big-tech stocks have reached record highs as companies continued to beat earnings estimates, pushing valuations to a record high. The strong earnings growth seen over the past year may be difficult to sustain in the coming quarters.
- Segments exposed to corporate demand (cloud, digital advertising, cybersecurity) have done better compared to those exposed to consumer demand. This trend is expected to continue as businesses speed up their digital transformation efforts.
- Among the various segments, cloud computing, in particular, is expected to deliver strong growth, driven by rising adoption rates and greater demand from an increasing pool of end applications.
- Lofty valuations, potential slowdown in earnings growth, and regulatory risks are factors that may limit the upside of internet companies in the near-term. Maintain 2.5 Stars “Neutral” rating.
Chart 11: O’Shares Global Internet Giants ETF (OGIGXT Index) Price and Forecasted EPS
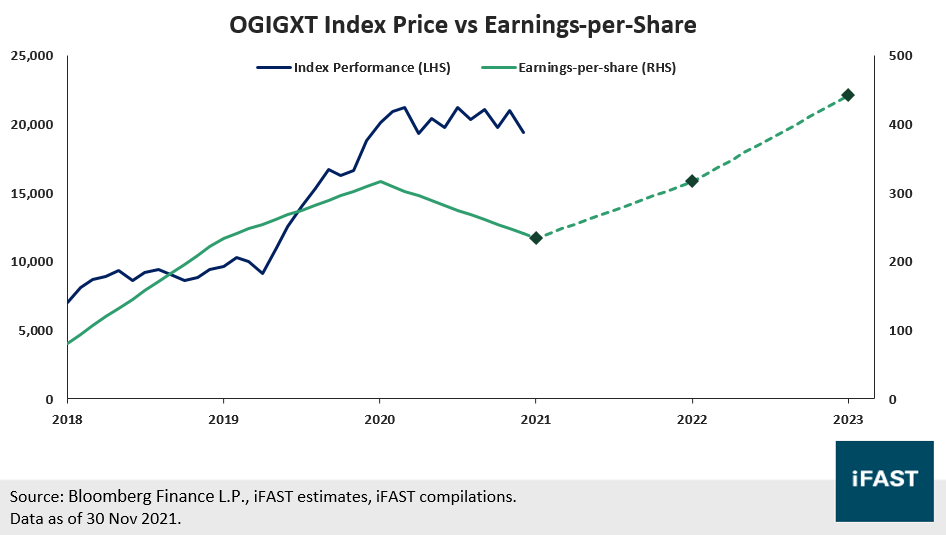
Table 11: Projections and Potential Upside for O’Shares Global Internet Giants ETF
| Digital Economy (OGIGXT Index) | FY20 | FY21 | FY22 | FY23 |
| PE Ratio (X) | - | 82.4 | 61.0 | 43.6 |
| Expected Earnings Growth YoY | 166% | 20% | 35% | 40% |
| Earnings Per Share (EPS) | 195 | 234 | 316 | 442 |
| Projected
Fair Price (based on fair P/E Ratio of 45.0X) |
- | - | - | 53 |
| Potential Upside from Today (%) | - | - | - | 3% |
| Source: Bloomberg Finance L.P., iFAST estimates. Data as of 30 Nov 2021. | ||||
15. China Digital Economy: Expect a strong turnaround in 2022
- While 2021 was a tough year for Chinese tech stocks, fundamentals in 1H21 remained strong, with continued revenue growth as the pandemic has accelerated the adoption of technology.
- Crackdown not intended to deter the growth of tech companies, but rather to safeguard consumer interests and ensure sustainable growth of the sector. Long-term outlook remains positive.
- Regulatory impact likely to vary among companies, with some (e.g. Tencent and JD.com) likely to be more resilient than others (e.g. edtech companies). Having said that, there are recent signs that regulatory pressures are easing e.g. Meituan’s lower-than-expected fine, the wrapping up of Didi’s cybersecurity probe, and the resumption of game approvals.
- Share prices have bottomed and have started to rebound since Oct 2021. We think that the regulatory overhang will fade off as companies continue to deliver strong earnings. Valuations remain more attractive compared to US peers. Expect a strong turnaround in 2022.
The Research Team is part of iFAST Financial Pte Ltd.
All materials and contents found in this site are strictly for general circulation and informational purposes only and should not be considered as an offer, or solicitation, to deal in any of the funds or products found/identified in this site. While iFAST Financial Pte Ltd ("IFPL") has tried to provide accurate and timely information, there may be inadvertent delays, omissions, technical or factual inaccuracies and typographical errors. Any opinion or estimate contained in this report is made on a general basis and neither IFPL nor any of its servants or agents have given any consideration to nor have they or any of them made any investigation of the investment objective, financial situation or particular need of any user or reader, any specific person or group of persons. You should consider carefully if the products you are going to purchase are suitable for your investment objective, investment experience, risk tolerance and other personal circumstances. If you are uncertain about the suitability of the investment product, please seek advice from a financial adviser, before making a decision to purchase the investment product. Past performance is not indicative of future performance. The value of the investment products and the income from them may fall as well as rise. Opinions expressed herein are subject to change without notice. In respect of any matters arising from, or in connection with the said research analyses or research reports, recipients of the report are to contact IFPL at 10 Collyer Quay, #26-01 Ocean Financial Centre Building, Singapore 049315, or by telephone at +65 6557 2853. Where the report contains research analyses or research reports from a foreign research house and if the recipient of such research analyses or research reports is not an accredited investor, expert investor, institutional investor or an ex-accredited investor, IFPL accepts legal responsibility for the contents of such analyses or reports to such persons only to the extent as required by law. Please note that only certain security(ies) herein are available to all investors, while the rest are only available for certain persons to invest in, such as Accredited Investors (as defined in the Securities and Futures Act) or one who invests at least S$200,000 (or its equivalent currency) per transaction. To qualify as an Accredited Investor, one needs to submit a declaration form and certain relevant supporting documents, according to iFAST’s prevailing policies and procedures.
Please read our full disclaimers on the website at ( https://secure.fundsupermart.com/fsmone/policies/328125/investment-account-terms-&-conditions).
iFAST Financial Pte Ltd (IFPL) (registered address: 10 Collyer Quay #26-01 Ocean Financial Centre Singapore 049315, Telephone: 6557 2000) holds the Financial Advisers Licence issued by the Monetary Authority of Singapore ('MAS') to conduct regulated activities of advising on securities, marketing of collective investment schemes and arranging of any contract of insurance in respect of life policies, other than a contract of reinsurance and the Capital Markets Services Licence issued by the MAS to conduct regulated activities of dealing in securities and providing custodial services for securities. While IFPL has made every effort to ensure the independence of the report's contents, IFPL's nature of business is such that IFPL and its connected and associated entities together with their respective directors, officers and staff may be involved in providing dealing or investment-related services in the abovementioned securities, and have taken or may take positions in the securities mentioned in this report, and may also act as the principal for any buy or sell trades.