

Growth of US economy and market could take off as quickly as the 2nd quarter of 2021. The notion is supported by favourable tailwinds such as (i) improving global growth outlook, (ii) lagged effects of measures this year, (iii) supportive policy backdrop and potentially (iv) the mass distribution of Covid-19 vaccine among US citizens.
- Valuations of S&P 500 index are expensive relative to history - trading more than forward PE of 20.0X. But we see two major reasons why current valuation is justified in the current macro backdrop.
- Earnings of S&P 500 Index will be driven by a healthy mix of secular and cyclical growth factors in the next two years - projected to jump by more than 27% and 17% - partly due to low base effect this year.
- Our target price for S&P 500 Index by end-2022 represents an upside potential of +20% from yesterday’s closing price. The rosier growth prospect, alongside a strong line-up of positive catalysts, render the US equities an attractive bet for the year ahead.
- Thus, we upgrade our ratings for US equities to 3.0 Stars “Attractive”.
Chart 1: US equities registered positive returns of 16.5% on a 1-year basis, in a recession year.
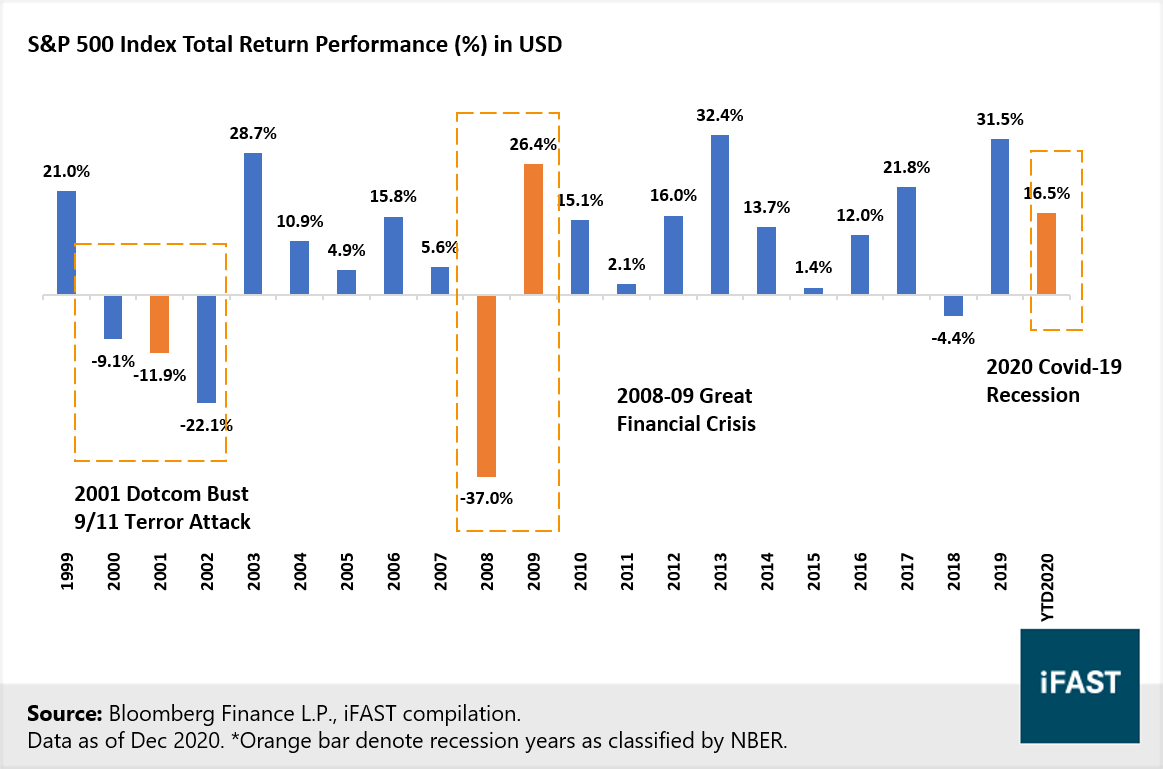
Chart 2: US equity funds have not done shabbily either – up 9.5% on aggregate in SGD terms.

2021 Outlook: Looking past the recession year, a rosier outlook lies in the horizon
Chart 3: We expect to see a checkmark-shaped recovery in US next year

Economy: A Bumpy Recovery but Brighter Days ahead
Chart 4: Policymakers must implement more supportive measures or risk further economic scarring

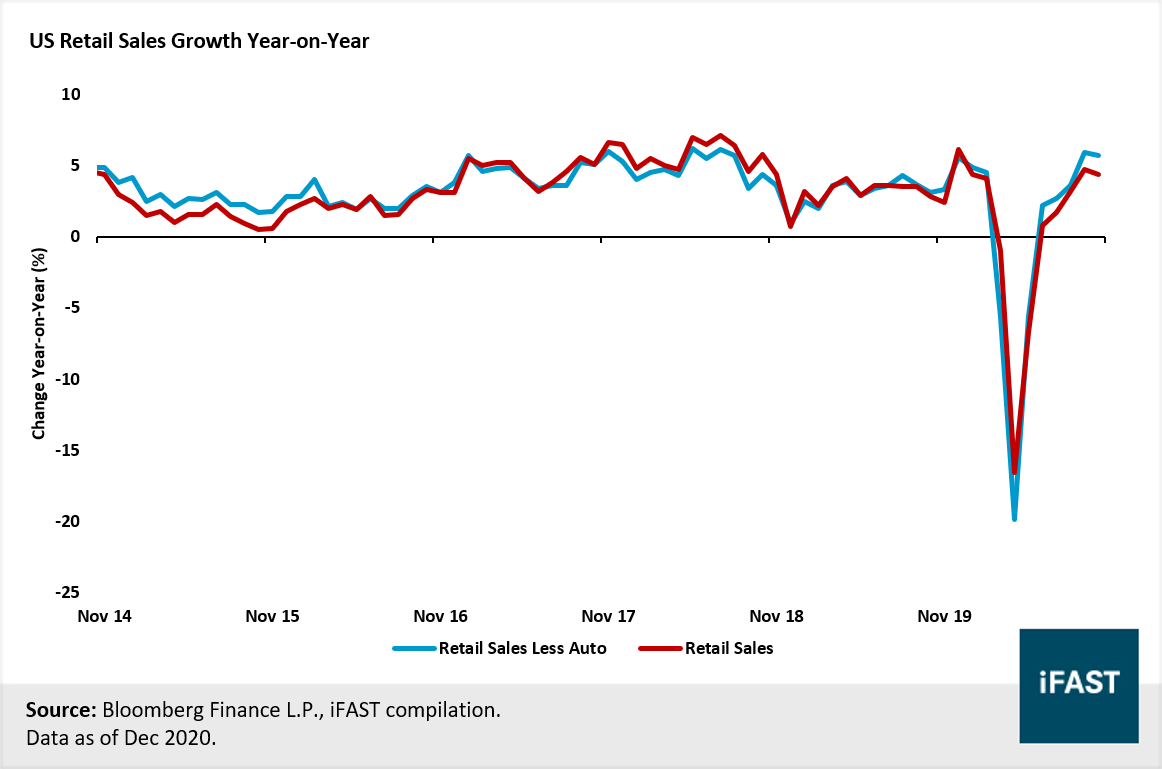
Chart 5: The consumer rebound has been swift despite worsening Covid-19 crisis – providing glimmer of hope for US economic future.
Are valuations too expensive now?
Chart 6: S&P 500 equities have expanded rapidly in valuation over the last few years.

- lower rates increase the discounted present value of future cash flows
- encourage risk taking behaviour because financing costs for leveraged positions are low
- equities are more attractive to investors on a relative basis because dividend and earnings yields are much higher than fixed income yields
Chart 7: Easy monetary policies have driven up asset price inflation – especially in the S&P 500 equities.

Chart 8: Technology and tech-related sector weigh nearly one-third of the S&P 500 Index now

Earnings growth outlook are slated to improve significantly in 2021
Chart 9: Corporate earnings are projected to face a double-digit contraction this year, for first time since 2008.

Table 1: Most of S&P 500 companies are projected to deliver double-digit earnings growth next two years.
|
No. |
S&P 500 Top 10 Holdings |
Weight |
Sector |
2020 EPS% |
2021 EPS% |
2022 EPS% |
|
1 |
Apple Inc |
6.2% |
Information Technology |
21.2% |
9.3% |
7.5% |
|
2 |
Microsoft Corp |
4.8% |
Information Technology |
19.0% |
10.1% |
15.6% |
|
3 |
Amazon.com Inc |
4.7% |
Consumer Discretionary |
48.5% |
22.3% |
35.3% |
|
4 |
Alphabet Inc |
3.6% |
Communication Services |
-7.2% |
22.7% |
19.7% |
|
5 |
Facebook Inc |
2.4% |
Communication Services |
8.4% |
12.9% |
19.2% |
|
6 |
Berkshire Hathaway Inc |
1.6% |
Financials |
-10.4% |
15.4% |
11.0% |
|
7 |
Visa Inc |
1.5% |
Information Technology |
9.0% |
26.1% |
16.6% |
|
8 |
Walmart Inc |
1.2% |
Consumer Staples |
12.3% |
2.3% |
6.8% |
|
9 |
Johnson & Johnson |
1.2% |
Health Care |
-7.9% |
13.0% |
9.0% |
|
10 |
JPMorgan Chase & Co |
1.1% |
Financials |
-26.2% |
22.2% |
16.4% |
|
Source: Bloomberg Finance L.P., iFAST compilation. Data as of Dec 2020. |
||||||
Chart 10: Earnings for S&P 500 Index is likely driven by a healthy mix of secular and cyclical growth factors ahead

What could derail US equities ahead?
Despite trading at record-high level, US equities could advance by +20% in the next two years
Table 2: We think it’s likely that S&P 500 Index could close above 4,400 by end-2022
|
US S&P 500 Index |
FY2019 |
FY2020 |
FY2021 |
FY2022 |
|
PE ratio (X) |
22.3 |
24.9 |
19.5 |
16.7 |
|
Expected earnings growth (YoY %) |
0.8% |
-10.4% |
27.7% |
17.2% |
|
Earnings Per Share (EPS) |
163.8 |
146.8 |
187.5 |
220.0 |
|
Projected fair price (Based on 20.0X Fair PE ratio) |
3,276 |
2,935 |
3,750 |
4,400 |
|
Potential upside (%) |
- |
- |
- |
+20% |
|
Source: Bloomberg Finance L.P., iFAST estimates. Data as of Dec 2020. |
||||
Our US Strategy for 2021: 50-50 on Cyclical Rotation and Secular Growth
Table 3: Products that investors can consider for Small-Cap and Large-Cap US growth stocks
|
Sector/Product |
Active Funds |
Passive ETFs |
|
Small-Cap Growth |
||
|
Large Cap Growth |
Chart 11: We believe US equities are an attractive bet for the year ahead, despite the frothy valuations.

The Research Team is part of iFAST Financial Pte Ltd.
All materials and contents found in this site are strictly for general circulation and informational purposes only and should not be considered as an offer, or solicitation, to deal in any of the funds or products found/identified in this site. While iFAST Financial Pte Ltd ("IFPL") has tried to provide accurate and timely information, there may be inadvertent delays, omissions, technical or factual inaccuracies and typographical errors. Any opinion or estimate contained in this report is made on a general basis and neither IFPL nor any of its servants or agents have given any consideration to nor have they or any of them made any investigation of the investment objective, financial situation or particular need of any user or reader, any specific person or group of persons. You should consider carefully if the products you are going to purchase are suitable for your investment objective, investment experience, risk tolerance and other personal circumstances. If you are uncertain about the suitability of the investment product, please seek advice from a financial adviser, before making a decision to purchase the investment product. Past performance is not indicative of future performance. The value of the investment products and the income from them may fall as well as rise. Opinions expressed herein are subject to change without notice. In respect of any matters arising from, or in connection with the said research analyses or research reports, recipients of the report are to contact IFPL at 10 Collyer Quay, #26-01 Ocean Financial Centre Building, Singapore 049315, or by telephone at +65 6557 2853. Where the report contains research analyses or research reports from a foreign research house and if the recipient of such research analyses or research reports is not an accredited investor, expert investor, institutional investor or an ex-accredited investor, IFPL accepts legal responsibility for the contents of such analyses or reports to such persons only to the extent as required by law. Please note that only certain security(ies) herein are available to all investors, while the rest are only available for certain persons to invest in, such as Accredited Investors (as defined in the Securities and Futures Act) or one who invests at least S$200,000 (or its equivalent currency) per transaction. To qualify as an Accredited Investor, one needs to submit a declaration form and certain relevant supporting documents, according to iFAST’s prevailing policies and procedures.
Please read our full disclaimers on the website at ( https://secure.fundsupermart.com/fsmone/policies/328125/investment-account-terms-&-conditions).
iFAST Financial Pte Ltd (IFPL) (registered address: 10 Collyer Quay #26-01 Ocean Financial Centre Singapore 049315, Telephone: 6557 2000) holds the Financial Advisers Licence issued by the Monetary Authority of Singapore ('MAS') to conduct regulated activities of advising on securities, marketing of collective investment schemes and arranging of any contract of insurance in respect of life policies, other than a contract of reinsurance and the Capital Markets Services Licence issued by the MAS to conduct regulated activities of dealing in securities and providing custodial services for securities. While IFPL has made every effort to ensure the independence of the report's contents, IFPL's nature of business is such that IFPL and its connected and associated entities together with their respective directors, officers and staff may be involved in providing dealing or investment-related services in the abovementioned securities, and have taken or may take positions in the securities mentioned in this report, and may also act as the principal for any buy or sell trades.