Macro Research

Singapore: First recession after 2008 Financial Crisis. Is the market still attractive?

The Covid-19 pandemic hit Singapore when it was barely recovering from a slowdown due to the US-China trade war. Consequently, SG fell into a deep recession in 2Q 2020, driven by a severe hit on exports and its deeply globalized services. Is Singapore still attractive or deserving of a downgrade? Read more to find out.

  • |
  • Published on 26 Jul 2020

Singapore: First recession after 2008 Financial Crisis. Is the market still attractive? | Open a FREE FSMOne account and manage all your investments conveniently in ONE place

  • Singapore fell into a deep recession in the second quarter this year, driven by a severe hit on its exports and deeply globalized services sectors due to the Covid-19 pandemic. 

  • The economic recovery back to pre-Covid levels might take longer than its Asian peers. Singapore's past economic resilience, which stemmed from its deeply globalised services-oriented economy (finance, air travel, shipping and hospitality) is being greatly tested by the nature of the Covid-19 induced slowdown. 

  • While Singapore equities are cheaply valued, we think the impetus for a meaningful re-rating maybe lacking ahead, due to (i) mediocre economic growth expectation, (ii) lacklustre earnings growth and (iii) challenges facing STI constituent companies. 

  • Singapore's high dividend yield of 3.6-4.5% means that investors will remain adequately compensated while waiting for prices to recover. We also expect an attractive upside potential of +25% by end-2022, which is easily achievable considering its cheap valuation. 

  • Given that the macro outlook remains challenging while equities plagued by growth and structural headwinds, we temper our expectation for the market and downgrade our ratings for Singapore equities to 3.5 Star "Attractive". 

Without a doubt, the Covid-19 outbreak was one of Singapore’s greatest economic challenge. The pandemic hit the nation at a bad time when it was barely recovering from the US-China trade war, year-on-year (YoY) gross domestic production (GDP) for 2019 was only 0.7%. 

The global manufacturing and trade cycle had just demonstrated nascent signs of recovery when Covid-19 hit first Asia. The recovery and economic momentum was snuffed out when Singapore’s Asian trade partners rushed into lockdown in early March 2020, halting the nation’s recovery.

Trade indicators such as manufacturing purchasing manager index (PMI), electronics PMI and new order clearly reflected pre-Covid-19 weakness in external demand (chart 1). On the other hand, retail sales also highlighted a slump in domestic consumption pre-Covid-19 (chart 2) due to the trade war.

Chart 1: Global trade weakness affected Singapore even before Covid-19


Chart 2: … Domestic demand also soft before the pandemic  


Slumped into recession in 2Q 2020


Singapore’s quarter-on-quarter (QoQ) GDP growth fell from -3.3% in Q1 2020 to -41.2% in 2Q 2020, by far the largest contraction ever seen. On a year-on-year (YoY) basis, the nation also hit a record low of -12.6% contraction in 2Q 2020 (chart 3). The latest GDP figure not only confirmed Singapore slumped into a technical recession, but also a deep one.

We believe the key reasons for 2Q 20’s nosedive in GDP to be - (i) the severe hit on Singapore’s exports and (ii) its deeply globalized services sector.

Firstly, export demand was greatly eroded as a result of lockdown measures implemented by Singapore’s trading partners. Singapore’s exports saw hefty back-to-back contractions in April and May. Given the nation’s export-reliant economy, with exports typically being over 170% of its GDP, the plunged in exports was an insurmountable drag on growth (chart 3). 

Secondly, Singapore is a services-heavy economy (around 71% of GDP) with many of the service sectors being deeply globalized. As a leading hub for regional finance, air travel, shipping and hospitality, Singapore’s services business is extremely reliant on the region’s economic activities. 

Given the almost ‘synchronised’ wave of lockdown across Asia, there was a subsequent plunge in foreign demand for Singapore’s services sector. Sectors such as air travel, shipping, retail and hospitality were amongst the hardest hit and these are signifant contributors of growth. Domestic service businesses was also hit badly after Singapore’s own lengthy lockdown. As a result, the nation’s service sector was dealt with a severe double whammy.

Chart 3: Slump in exports dragged Singapore into a recession


Chart 4: Services industries hit severely this time 


Long road to recovery back to pre-Covid levels


We expect a protracted economic recovery to pre-covid-19 levels due to i) the depth of the recession, ii) the lack of a robust domestic economy to fire up the economic recovery and iii) severe contraction in the services industries.

Since 1970s Singapore has become increasingly dependent on export as a driver of economic growth, export as a percent of GDP has risen from 53% to 178% (chart 5). Conversely, consumption’s contribution to growth has been on a secular decline.

Without a robust and ‘large enough’ domestic market, Singapore may find it tough to restart the economy by stimulating domestic demand alone. The nation relies significantly on external demand and for global trade to pick up, which could prolong its path to recovery. 

As discussed above, Singapore’s services industries are significantly reliant on foreign demand, particularly within Asia. Thus, the lockdown implementation in these countries translated to a huge hit in the hospitality and F&B industries as well as the transportation (air travel and shipping) and storage industries (chart 6).

With social distancing and travel restrictions likely extending into 2021 for Singapore and Asian economies, these industries (and many others) could remain in a slump for the coming quarters. Also, general malaise in economic activities for Asian economies would also mean frail demand for Singapore’s services sector. All together, the nation’s economic recovery may continue to be weighed down by the overall weakness in its service sector.

Chart 5: Dependency on exports means SG lacked the domestic demand to drive a recovery


Chart 6: Accommodation and food services, largest contributor to growth, contracted the most


Nascent signs of recovery but long journey ahead


Nonetheless, Singapore’s leading economic indicators (i.e. electronics exports, electronics PMI and new orders) have rebounded and suggests green shoots of global demand recovery. This can be observed in S. Korea (another major export nation) as well, and confirms that the worst is likely over for Singapore.

While, we are positive that Singapore will recover back to pre-Covid-19 levels in 2022 (chart 7), the recovery might take longer than its Asian peers (i.e. China, Taiwan etc.). The difference in macro factors diminishes Singapore equities’ relative appeal against regional peers.

Chart 7: Protracted recovery expected. GDP to rebound back to pre-Covid level in 2022


Valuation lacking catalysts to drive mean reversion


Singapore equities (as gauged by the STI index) have been facing much headwinds in the recent years. Valuation level has been suppressed, trading below historical average, for more than 2 years, the longest period across history. 

(The only exception after May 2018 were in June ’20, where earnings estimates have been revised down significantly. This is not representative of a strong re-rating) 

Since mid-2018, valuations lacked the catalysts to drive a mean reversion and re-rating. We believe this is held back by three core reasons - i) mediocre economic growth expectation, ii) lacklustre earnings growth and iii) challenges facing constituent companies. 

Given most of these factors are structural in nature (as explain below), our team expects Singapore equities to face challenges in re-rating strongly looking ahead.

Chart 8: Valuation lacking catalysts to re-rate since mid ’18…


Chart 9: … Relationship is clear for forward Y+1 PE ratio


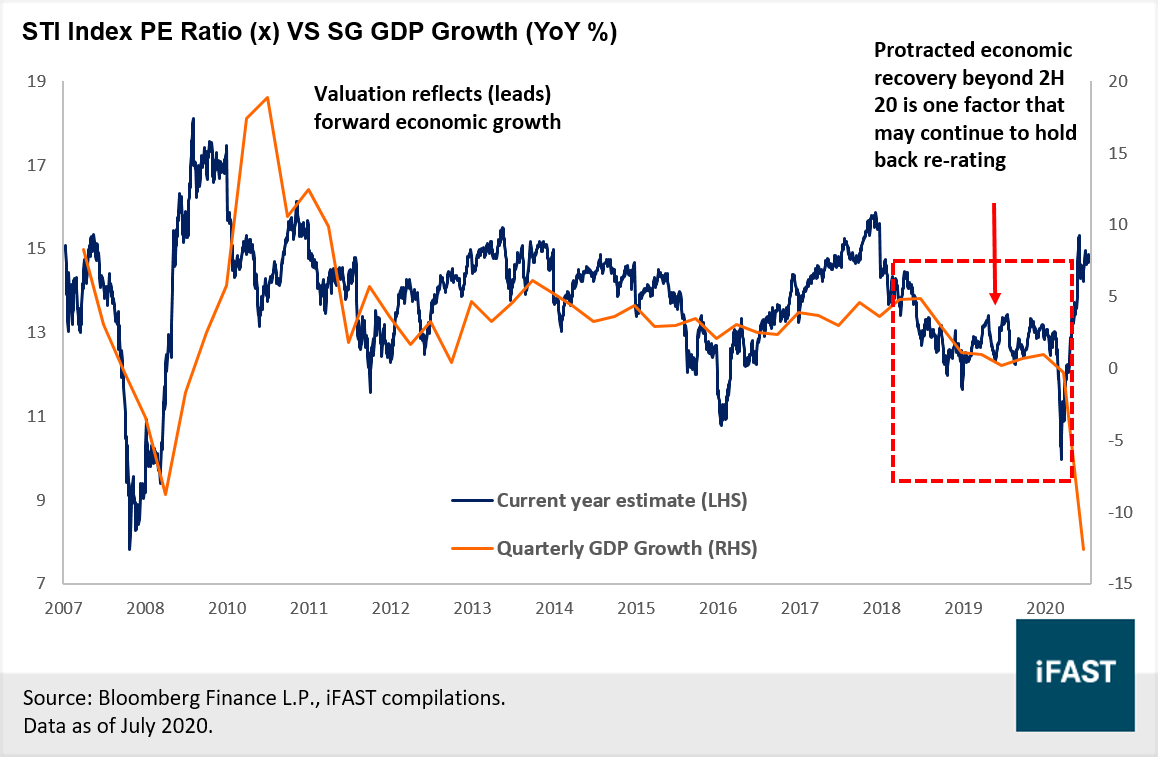
(i) Factors holding back re-rating - Mediocre economic growth expectation


Valuation for Singapore equities have across history been reflective of the nation’s expected economic growth (chart 10). An example would be in 2018 where the poor economic prospect after the trade war being reflected in a de-rating in valuation, falling below mean for an extended period.  

We have similarly witnessed such trends during 2008 recession, where valuations bottomed and then peaked ahead of a similar trend in Singapore’s GDP growth. (We note that since 2015, valuation has been less reflective of expected economic growth and this reaffirms our belief that there are other catalysts at play, as discussed in prior section).

Given the protracted recovery facing Singapore, which dampens its growth expectation, we believe the likelihood of a sustain strong re-rating remains low. This may limit upside potential for Singapore’s equity market.

Chart 10: Valuation reflective of forward economic growth


(ii) Factors holding back re-rating - Lacklustre earnings growth


Similarly, earnings growth and profit margin for Singapore’s corporates has been unimpressive in recent years. Earnings growth fell to 0.2% (2019) from 12.1% (2018). Even before the tradewar growth for 2017 was about 5.5% YoY.

It is clear that the decline in 2018’s earnings was in large due to the tradewar but much of the earnings malaise Pre-Covid-19 was also a result of idiosyncratic challenges facing the constituent companies (explained below).

Over the last 2 years, earnings failed to beat estimates for 4 out of the last 8 quarters. Conversely, only 1 quarter had a decent positive surprise while the remaining 3 were relatively muted. The earnings surprise magnitudes were also affirmative of the lackluster earnings growth over recent years.

All things considered, we believe lackluster earnings growth was another major factor holding back a meaningful re-rating. Looking ahead, it is likely that Singapore equities’ profit margin cycle have peaked and earnings are unlikely to recover to pre-covid level until 2022 (chart 11). This suggest a lack of impetus for strong valuation re-rating. 

Chart 11: Earnings and profit margin hit hard by the trade war after 2018


(iii) Factors holding back re-rating - Challenges facing constituent companies


The Singapore equity market (as measured by STI Index) comprises the largest 30 SGX-listed companies ranked by their full market capitalisation. As such, the STI Index has significant weightages (collectively more than 80%) towards to the Financial, REITs and Industrial sectors, which tend to underperform during periods of economic downturn. 

Given the nature of Covid-19 crisis, we think that the current recessionary environment is particularly challenging for constituent companies. Not only is the Covid-19 pandemic materialising as direct headwinds facing Industrial sector (transport and Oil & gas), it has shored up as economic weakness affecting the Financial and Real Estate sectors – which we have detailed below.

Chart 12: Singapore equity market is heavily weighted towards Financials and Real Estate. 


Challenging Backdrop ahead for the Financials sector 


We think that the banks are going to face a challenging backdrop ahead, with lacklustre earnings putting a downward pressure on the performances of bank stocks.

We expect net interest margin (NIM) to further compress ahead, given the accommodative monetary policy by the Fed (zero-bound interest rate environment to persist till end of year). As such, we expect interest rates in Singapore and Hong Kong (Sibor and Hibor) to edge downwards, and the reduction in loan yields to exert downward pressure on NIM (Chart 13) Since a significant proportion (more than 60%) of revenue for Singapore banks are derived through interest income, the downwards slide in NIM is a major drag for the banks in the near-term (Chart 14).

To make matter worse, the banks are likely to incur higher credit cost due to the rising loss provision. We expect non-performing loan (NPL) ratio to pick up due to weak economic activities in key markets such as Singapore, Southeast Asia and China. While this partially offset by rise in non-interest income (higher capital market trading and wealth management fees – greater Foreign wealth inflows), we think this is unlikely to buttress the more significant decline in earnings due to falling interest rates.

Chart 13: Falling interest rate environment in Singapore and Hong Kong due to accommodative monetary policies. 


Chart 14: Singapore banks face steep decline in interest income due to the falling rates environment. 


Outlook for Real Estate sector is not rosy either


As the second largest segment of STI (weighing around 20%), the uncertain pace of recovery in the property sector (developers and REITs) – due to risk of “second wave” of Covid-19 outbreak –
poses as a major drag on Singapore equity market as well. 

Seeing how other densely populated cities like Seoul and Hong Kong have been hit by new waves of local Covid-19 cases after relaxing their social distancing rules, we think Singapore policymakers may err on the cautious side, which likely result in an extended Phase 2 of reopening. 

For hospitality and retail REITs (alongside entertainment and retail), the outlook remains murky, especially as tourist footfall is unlikely to return to pre-crisis level anytime soon. For office REITs, we expect the practice of ‘Working from Home’ to stay around till end of this year, leading to reduction in demand for co-working spaces, thus placing pressure on office rent and negative/flat rental reversion this year. 

For developers, the fall in residential prices (due to rising unemployment from recession) would materialise as discounts in their net asset value (NAV), meaning the beaten down valuations will no longer be cheap once the NAV reflects the near-term impairment. However, a revival in sales volumes (especially from foreigners) could be a positive catalyst, mitigated by job support schemes and mortgage deferments from Singapore government. 

However, while the outlook for REITs are not entirely gloomy, the lower interest rates (from accommodative monetary policies from global central banks) remain supportive of S-REITs and developers. The ‘lower for longer’ environment also engender an expectation of flat yield curve, which has historically been a key pillar for S-REITs performance (Chart 12). 

Chart 15: While lower interest rates support the REITs performance, but outlook remains mixed among the REITs. 


Attractive dividend yield is Singapore's silver lining


We estimate the STI to deliver a forward dividend yield of 4.0% by end 2020. This is the highest among all Asian markets, exceeding the second highest market (China H) by around 100bps (chart 16). While the recent jump in dividend yield (compared to 2019) was largely due to share prices plummeting, the same can be observed for all markets. 

Dividend for Singapore equities are expected to drop by around 10%, according to consensus projection, but we adopted a more conservative projection of a 23% decline. This comes as the bottom line for banks, property-related and telecommunication sectors, which contribute around 70% of total dividends, take a hit after the outbreak. 

Notwithstanding the decline in dividend payout (which most market will also suffer from), the STI still remains the highest yielding market in the region. Assuming STI recovers to pre-Covid-19 level by end 2020 (an unlikely scenario), the dividend yield should normalises to 3.2% - 3.6% (with a -10% to -23 drop in dividend), which is still around the historical average and attractive comparatively (Chart 17). 

Such yield level is even more appealing in the ‘lower for longer’ interest rates environment. Investors are also being paid while waiting for valuations to re-rate and more importantly, such high yield should provide downside support if Singapore’s economic recovery drags.

Chart 16: Singapore equities offer highest yield among all Asian markets


Chart 17: Dividend yields at an attractive level, even if they normalise to historical average.


Downgrade Singapore to 3.5 Stars ‘Attractive’


Our team expects a protracted economic recovery to pre-Covid-19 levels from 3Q 2020 onwards. A huge reason is the lack of a robust domestic economy to fire up the economic recovery. 

The relative underperformance of the STI Index may also be attributed to its composition, consisting largely of REITs and financials, and has a dearth of tech and healthcare companies – which have been key growth drivers in other equity markets.

While valuation of Singapore equities is now cheap on a historical basis and is also trading way below our fair value, we think valuation is likely to remain in such depressed level, given the lack of catalysts to drive a re-rating or a mean-reversion. We believe this is held back by (i) weak expected economic growth, (ii) lacklustre corporate earnings growth and (iii) challenges facing constituent companies amid Covid-19.
 
That said, Singapore equities’ high dividend yield of 3.6-4.5% means that investors will remain adequately compensated while waiting for prices to recover. Its current cheap valuation meant that investors can realise an upside potential of +25% by end-2022, as valuation swings back to fair upon a more optimistic outlook then.

Singapore Equities
(Straits Times Index)

FY 2020

FY 2021

FY 2022

PE Ratio (X)

15.1

13.0

11.1

Expected Earnings Growth %YoY

-30.0%

16.0%

16.0%

Earnings Per Share

171.2

198.6

230.4

Projected Fair Price
(Based on 14.0X Fair PE Ratio)

2,397

2,780

3,225

Potential Upside from Today (%)

-

-

+25%

Source: Bloomberg Finance L.P., iFAST estimates. Data as of Jul 2020.


Given the challenging environment and the various longer-term structural headwinds facing Singapore equities, we temper our expectation for the market. We opt to be cautiously optimistic and downgrade to 3.5 Star “Attractive” rating on Singapore equities.

Equity Market

Actively Managed Fund

Passive tracking ETF

Singapore

Nikko AM Singapore Dividend Equity SGD

SPDR Straits Times Index ETF

Chart 18: While cheap, valuation of Singapore equities may remain depressed due to the lack of positive catalysts. 


Chart 19: Investor remains compensated with a decent dividend yield while waiting for valuation and prices to recover upon a more optimistic outlook. 


The Research Team is part of iFAST Financial Pte Ltd.    

All materials and contents found in this site are strictly for general circulation and informational purposes only and should not be considered as an offer, or solicitation, to deal in any of the funds or products found/identified in this site. While iFAST Financial Pte Ltd ("IFPL") has tried to provide accurate and timely information, there may be inadvertent delays, omissions, technical or factual inaccuracies and typographical errors. Any opinion or estimate contained in this report is made on a general basis and neither IFPL nor any of its servants or agents have given any consideration to nor have they or any of them made any investigation of the investment objective, financial situation or particular need of any user or reader, any specific person or group of persons. You should consider carefully if the products you are going to purchase are suitable for your investment objective, investment experience, risk tolerance and other personal circumstances. If you are uncertain about the suitability of the investment product, please seek advice from a financial adviser, before making a decision to purchase the investment product. Past performance is not indicative of future performance. The value of the investment products and the income from them may fall as well as rise. Opinions expressed herein are subject to change without notice. In respect of any matters arising from, or in connection with the said research analyses or research reports, recipients of the report are to contact IFPL at 10 Collyer Quay, #26-01 Ocean Financial Centre Building, Singapore 049315, or by telephone at +65 6557 2853. Where the report contains research analyses or research reports from a foreign research house and if the recipient of such research analyses or research reports is not an accredited investor, expert investor, institutional investor or an ex-accredited investor, IFPL accepts legal responsibility for the contents of such analyses or reports to such persons only to the extent as required by law. Please note that only certain security(ies) herein are available to all investors, while the rest are only available for certain persons to invest in, such as Accredited Investors (as defined in the Securities and Futures Act) or one who invests at least S$200,000 (or its equivalent currency) per transaction. To qualify as an Accredited Investor, one needs to submit a declaration form and certain relevant supporting documents, according to iFAST’s prevailing policies and procedures.

Please read our full disclaimers on the website at ( https://secure.fundsupermart.com/fsmone/policies/328125/investment-account-terms-&-conditions).

iFAST Financial Pte Ltd (IFPL) (registered address: 10 Collyer Quay #26-01 Ocean Financial Centre Singapore 049315, Telephone: 6557 2000) holds the Financial Advisers Licence issued by the Monetary Authority of Singapore ('MAS') to conduct regulated activities of advising on securities, marketing of collective investment schemes and arranging of any contract of insurance in respect of life policies, other than a contract of reinsurance and the Capital Markets Services Licence issued by the MAS to conduct regulated activities of dealing in securities and providing custodial services for securities. While IFPL has made every effort to ensure the independence of the report's contents, IFPL's nature of business is such that IFPL and its connected and associated entities together with their respective directors, officers and staff may be involved in providing dealing or investment-related services in the abovementioned securities, and have taken or may take positions in the securities mentioned in this report, and may also act as the principal for any buy or sell trades.

Ways to Invest with FSMOne
Why FSM
Don't have an account with us?
Open an account here
Need Financial Advice?
Make an appointment

We use cookies If you close this message or continue to use this site, you will consent to the use of Cookies, unless you choose to disable them. Click on our Privacy Policy to understand more.