


- Digital economy, a collective of long-term growth trends, is here to stay. E-Commerce and a wide range of e-Services, are underpinned by massive multi-years growth trends that have weaved seamlessly into our daily lives.
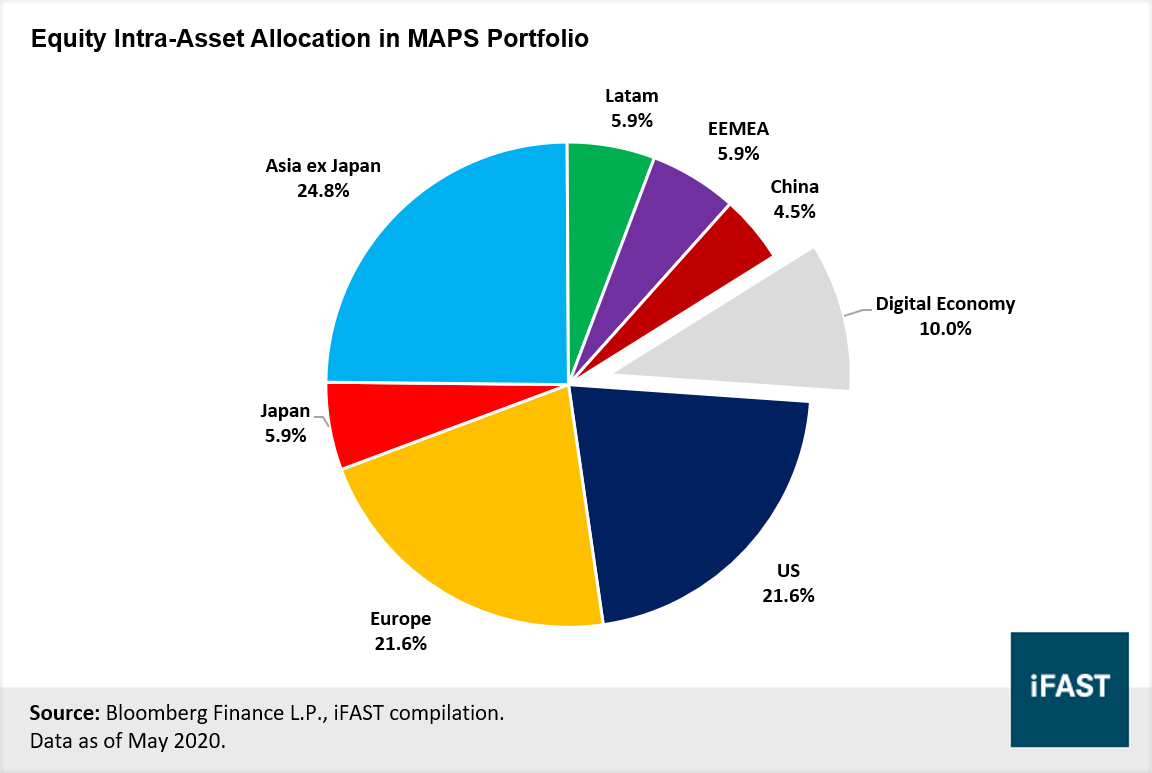
- Given its promising growth potential, as long-term investors ourselves, we decided to extend the conviction into our investment portfolios. Back last month in April, we have already allocated 10% of our core strategic allocation within MAPS portfolios towards the digital economy.
- While there are plenty of options to gain exposure to the digital economy, one ETF resonated most strongly to us: O’Shares Global Internet Giants ETF (NYSE:OGIG).
- Over last 10 years, internet stocks have seen a tremendous improvement in corporate fundamentals. Earnings and free cash flow have significantly outstripped other sectors as well as the broader index. The outperformance of fundamentals will likely continue for many years ahead, driven by the several mega trends.
- With the world spending ever more time online, digitalisation has become a necessity for countries to remain competitive in this new global backdrop. This necessity grew more pronounced amid the Covid-19 pandemic, where social distancing measures have severely affected the traditional physical-only businesses.
- We believe that digital economy is an investment theme that deserve to be in our investors’ portfolios, especially those with longer term investment horizon.
Digital economy, a collective of long-term growth trends, is here to stay
Table 1: The eight major segments that make up the digital economy
|
Segment |
Market Size (USD bil) |
Share of Digital Economy (%) |
|
Fintech |
5,492.3 |
57.7 |
|
e-Commerce |
2,027.9 |
21.3 |
|
e-Travel |
944.9 |
9.9 |
|
Digital Advertising |
331.5 |
3.5 |
|
Cloud Services |
213.5 |
2.2 |
|
e-Services |
190.0 |
2.0 |
|
Cybersecurity |
167.1 |
1.8 |
|
Digital Media |
150.0 |
1.6 |
|
Total |
9,517.2 |
100 |
|
Source: Statista, iFAST Compilations. Data as of May 2020. |
||
- E-commerce: The buying and selling of goods are shifting online at a rapid pace, displacing the traditional brick and mortar business model, giving rise to a whole new genre by itself: E-commerce. This relatively new industry is no longer novel, but increasingly the mainstream way consumers purchase products.
- Digital advertising: As E-Commerce proliferates, marketing efforts are rapidly expanding online as well. With majority of people now glued to their electronic devices all day long, advertisers are creating more innovative ways online to grasp the attention of these prospective customers. Video ads in Youtube videos, banner ads on mobile games and product placements in Instagram posts are among the various tools marketers use to maintain a strong online presence today.
- Cybersecurity: With growing amounts of data transmitted through the Internet, there is also an increasing demand for cybersecurity solutions to protect networks, computers and data from unauthorised access. Data breaches are ever more common in the digital space and can be extremely costly for the affected companies.
Digital economy is now part of our core equity allocation in MAPS portfolios
Chart 1: Digital economy is now part of the core equity allocation in our MAPS portfolios
OGIG – Our ETF of choice for exposure to global Digital economy
Table 2: Top holdings in OGIG ETF
|
Company |
Country |
Sector |
Weight (%) |
|
Amazon.com Inc |
US |
Consumer Discretionary |
5.8 |
|
Alphabet Inc |
US |
Communication Services |
5.2 |
|
Microsoft Corp |
US |
Information Technology |
4.7 |
|
Alibaba Group |
China |
Consumer Discretionary |
4.5 |
|
Tencent Holdings |
China |
Communication Services |
4.5 |
|
Facebook Inc |
US |
Communication Services |
4.3 |
|
Wayfair |
US |
Consumer Discretionary |
2.6 |
|
Pinduoduo Inc |
China |
Consumer Discretionary |
2.5 |
|
Shopify Inc |
Canada |
Information Technology |
2.4 |
|
Meituan |
China |
Consumer Discretionary |
2.2 |
|
Top 10 Holdings |
38.7 |
||
|
Source: O’Shares ETF Investments, Bloomberg Financials. Data as of 29 May 2020 |
|||
Chart 2: OGIG has exposure to Internet giants across the world
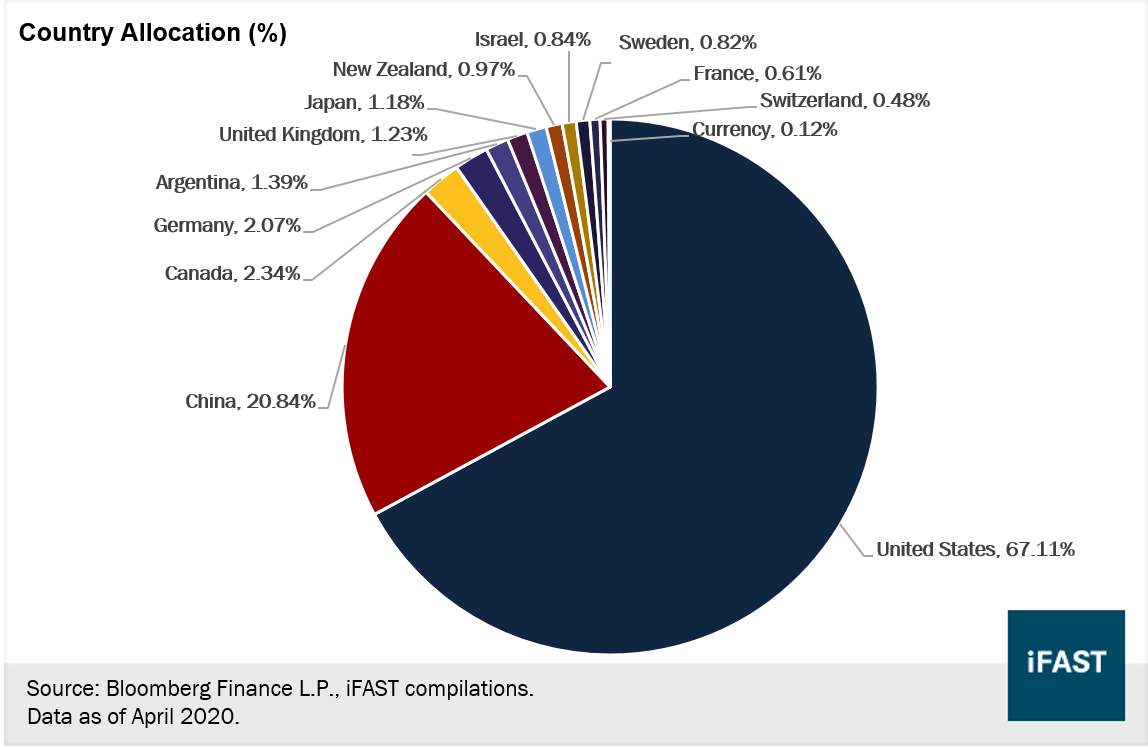
Technology stocks flourished alongside the digitalisation of global economy
Chart 3: Earnings of global tech companies outstrip the broader index
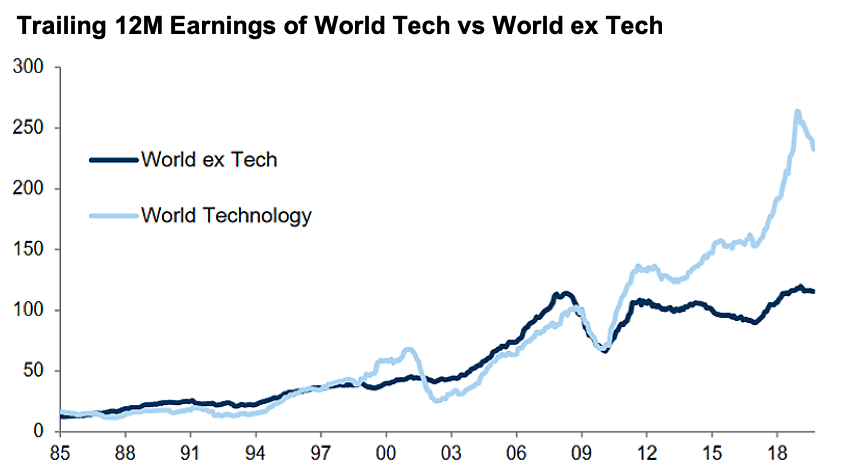
Source: Goldman Sachs Global Investment Research. Data as of Sep 2019
Chart 4: With strong earnings growth and corporate fundamentals, these tech companies had produced stellar performances in the stock prices
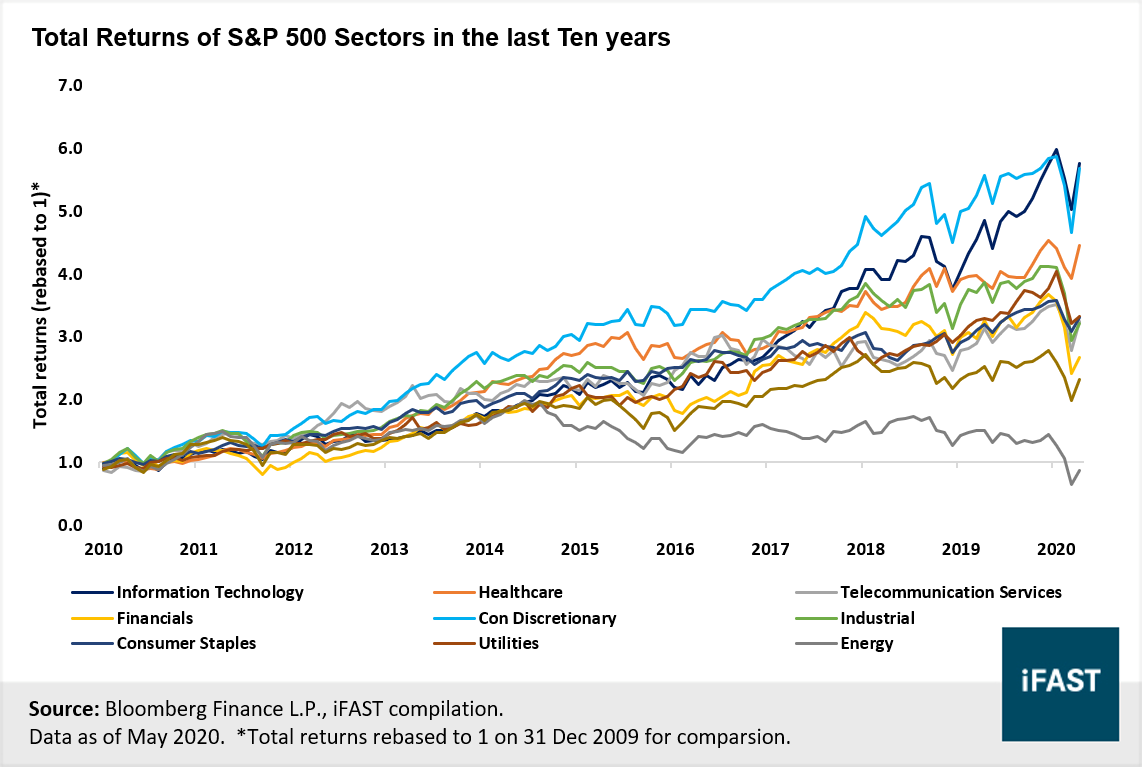
Table 3: Top constituents of OGIG ETF have grown in market cap and cash levels…
|
Companies in the Digital Economy |
Size |
Cash Balance |
Cash Flow |
|||||||
|
Market Cap (Bn) |
Cash & ST investment (bn) |
Cash/ EV |
TTM FCF Margin |
FCF Yield |
||||||
|
FY 2015 |
FY 2019 |
FY 2015 |
FY 2019 |
FY 2015 |
FY 2019 |
FY 2015 |
FY 2019 |
FY 2015 |
FY 2019 |
|
|
Amazon |
316.8 |
916.2 |
19.8 |
55.0 |
5.0% |
3.8% |
6.2% |
7.7% |
2.1% |
2.4% |
|
Alphabet |
528.0 |
922.9 |
73.1 |
119.7 |
3.6% |
2.3% |
22.2% |
19.1% |
3.1% |
3.3% |
|
Microsoft |
443.2 |
1203.1 |
113.2 |
133.8 |
1.9% |
1.2% |
27.4% |
30.4% |
5.7% |
3.2% |
|
Tencent |
185.0 |
460.6 |
12.6 |
26.9 |
3.7% |
4.0% |
38.6% |
32.4% |
3.3% |
3.8% |
|
|
296.0 |
585.3 |
18.4 |
54.9 |
1.8% |
3.5% |
33.9% |
30.0% |
2.1% |
3.6% |
|
Alibaba Group |
201.2 |
569.0 |
17.9 |
51.3 |
8.8% |
9.6% |
45.5% |
26.5% |
3.5% |
3.5% |
|
Shopify |
2.0 |
46.1 |
0.2 |
2.5 |
5.9% |
1.5% |
-0.4% |
0.9% |
0.0% |
0.0% |
|
Wayfair |
4.0 |
8.4 |
0.4 |
1.0 |
9.2% |
5.9% |
3.2% |
-6.5% |
1.8% |
-7.2% |
|
Total |
1976.2 |
4711.6 |
255.7 |
445.0 |
- |
- |
- |
- |
- |
- |
|
Source: Bloomberg Financials, iFAST compilations. Data as of May 2020. |
||||||||||
Table 4: …Profitability has also broadly risen over recent years for these companies
|
Companies in the Digital Economy |
Profitability |
Weight (OGIG ETF) |
|||||||
|
ROE |
ROIC |
TTM EPS |
Revenue (Bn) |
||||||
|
FY 2015 |
FY 2019 |
FY 2015 |
FY 2019 |
FY 2015 |
FY 2019 |
FY 2015 |
FY 2019 |
||
|
Amazon |
4.9% |
21.9% |
7.7% |
13.0% |
1.3 |
23.0 |
107.0 |
280.5 |
5.8% |
|
Alphabet |
14.1% |
18.1% |
16.4% |
17.2% |
23.2 |
48.4 |
75.0 |
161.9 |
5.2% |
|
Microsoft |
25.2% |
42.4% |
19.7% |
24.0% |
2.6 |
4.7 |
91.2 |
125.8 |
4.7% |
|
Tencent |
28.8% |
24.7% |
24.3% |
17.6% |
0.5 |
1.4 |
16.4 |
54.6 |
4.5% |
|
|
9.1% |
20.0% |
15.3% |
24.5% |
1.3 |
8.2 |
17.9 |
70.7 |
4.3% |
|
Alibaba Group |
39.4% |
23.9% |
10.9% |
10.0% |
1.9 |
6.4 |
15.9 |
73.2 |
4.5% |
|
Shopify |
- |
-4.9% |
-13.5% |
-5.0% |
-0.3 |
-1.1 |
0.2 |
1.6 |
2.4% |
|
Wayfair |
-28.3% |
-120.8% |
-29.5% |
-84.8% |
-0.9 |
-10.7 |
2.2 |
9.1 |
2.6% |
|
Total |
- |
- |
- |
- |
- |
- |
325.8 |
777.4 |
33.9% |
|
Source: Bloomberg Financials, iFAST compilations. Data as of May 2020. |
|||||||||
Digital economy a major beneficiary of indexation
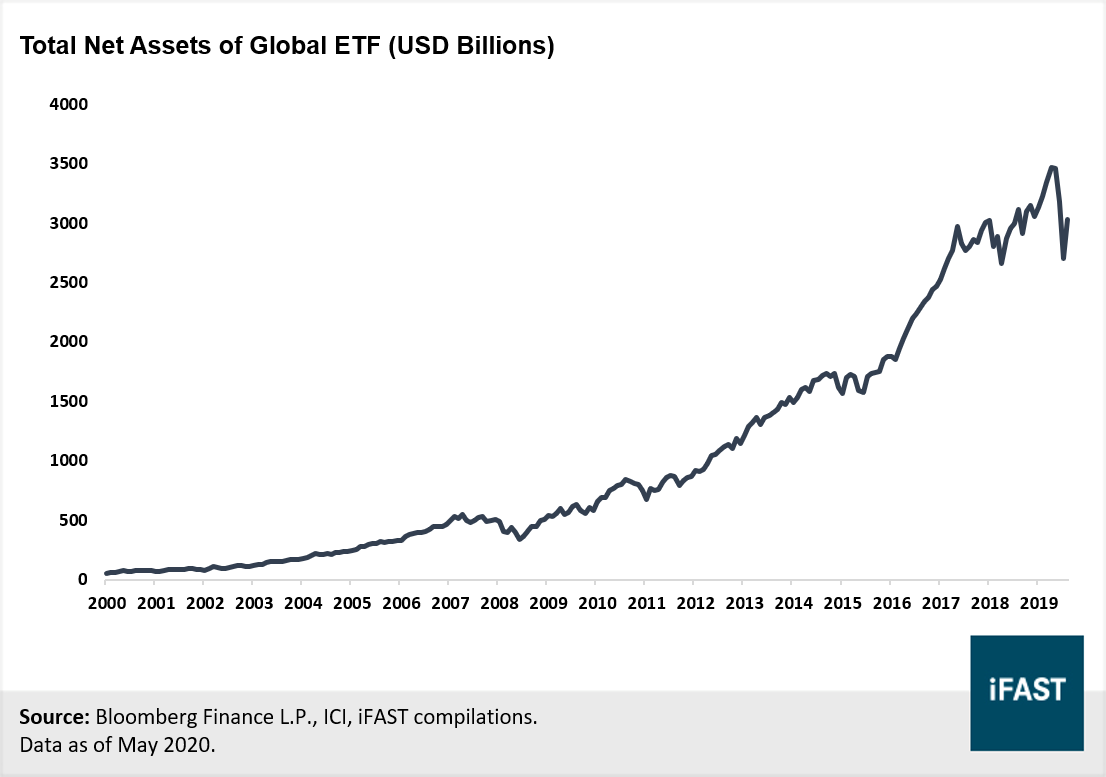
Chart 5: Net asset of ETF have skyrocketed over the last 10 years
Gone with the old, in with the new
Chart 6: Info Tech’s composition of risen significantly in recent years
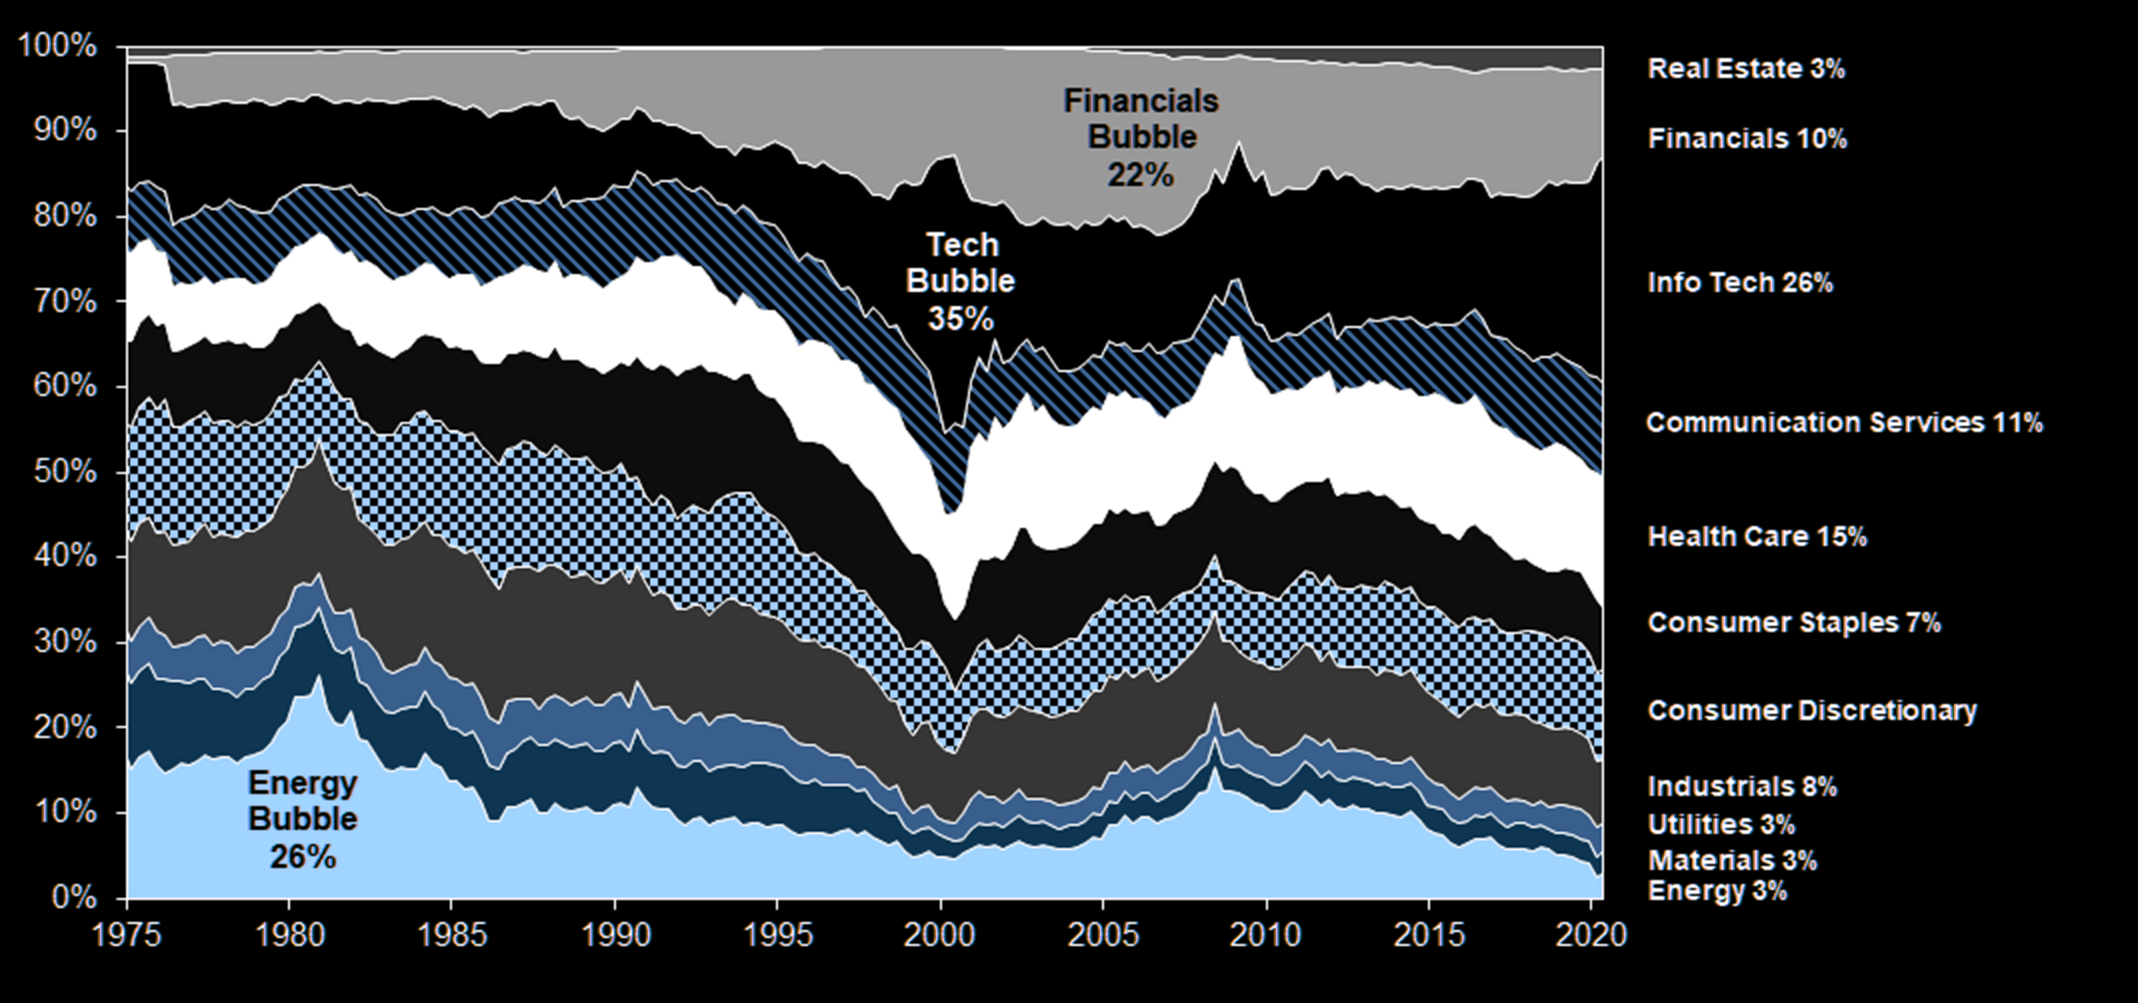
Source: Goldman Sachs Global Investment Research. Data as of April 2020.
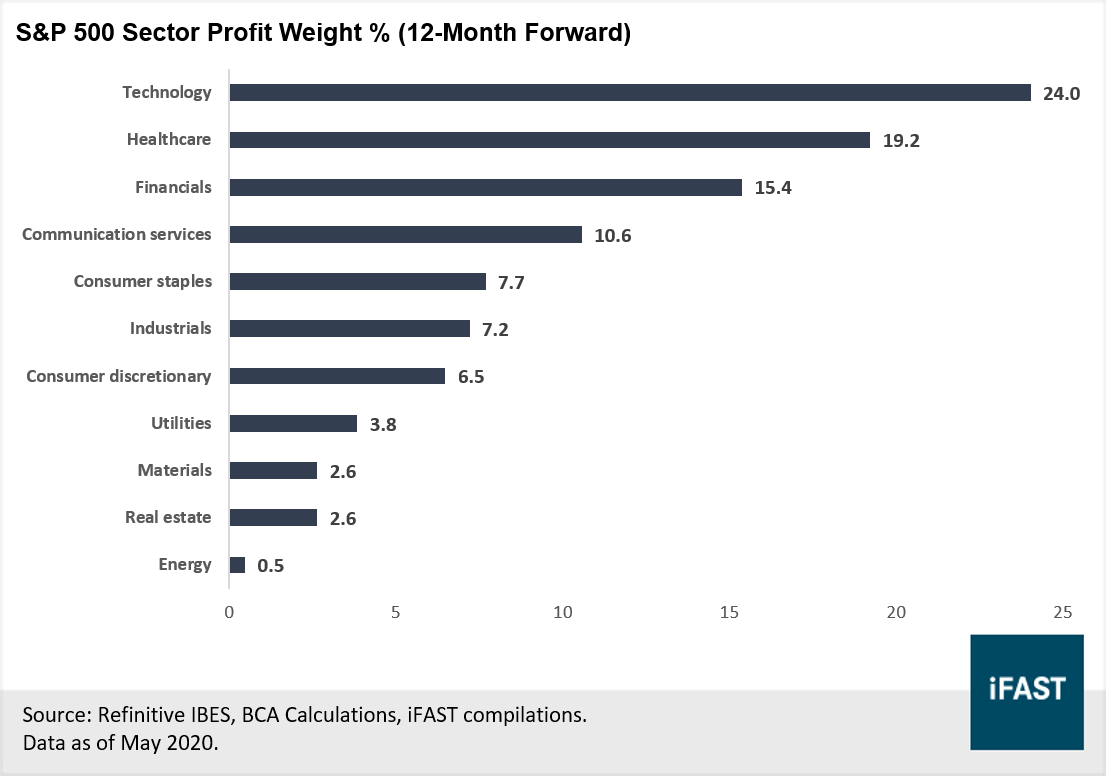
Chart 7: Internet stocks (incl Tech and Con disc) make up the lion share of profit in S&P 500
Digital economy deserves a space in investors’ portfolios
The Research Team is part of iFAST Financial Pte Ltd.
All materials and contents found in this site are strictly for general circulation and informational purposes only and should not be considered as an offer, or solicitation, to deal in any of the funds or products found/identified in this site. While iFAST Financial Pte Ltd ("IFPL") has tried to provide accurate and timely information, there may be inadvertent delays, omissions, technical or factual inaccuracies and typographical errors. Any opinion or estimate contained in this report is made on a general basis and neither IFPL nor any of its servants or agents have given any consideration to nor have they or any of them made any investigation of the investment objective, financial situation or particular need of any user or reader, any specific person or group of persons. You should consider carefully if the products you are going to purchase are suitable for your investment objective, investment experience, risk tolerance and other personal circumstances. If you are uncertain about the suitability of the investment product, please seek advice from a financial adviser, before making a decision to purchase the investment product. Past performance is not indicative of future performance. The value of the investment products and the income from them may fall as well as rise. Opinions expressed herein are subject to change without notice. In respect of any matters arising from, or in connection with the said research analyses or research reports, recipients of the report are to contact IFPL at 10 Collyer Quay, #26-01 Ocean Financial Centre Building, Singapore 049315, or by telephone at +65 6557 2853. Where the report contains research analyses or research reports from a foreign research house and if the recipient of such research analyses or research reports is not an accredited investor, expert investor, institutional investor or an ex-accredited investor, IFPL accepts legal responsibility for the contents of such analyses or reports to such persons only to the extent as required by law. Please note that only certain security(ies) herein are available to all investors, while the rest are only available for certain persons to invest in, such as Accredited Investors (as defined in the Securities and Futures Act) or one who invests at least S$200,000 (or its equivalent currency) per transaction. To qualify as an Accredited Investor, one needs to submit a declaration form and certain relevant supporting documents, according to iFAST’s prevailing policies and procedures.
Please read our full disclaimers on the website at ( https://secure.fundsupermart.com/fsmone/policies/328125/investment-account-terms-&-conditions).
iFAST Financial Pte Ltd (IFPL) (registered address: 10 Collyer Quay #26-01 Ocean Financial Centre Singapore 049315, Telephone: 6557 2000) holds the Financial Advisers Licence issued by the Monetary Authority of Singapore ('MAS') to conduct regulated activities of advising on securities, marketing of collective investment schemes and arranging of any contract of insurance in respect of life policies, other than a contract of reinsurance and the Capital Markets Services Licence issued by the MAS to conduct regulated activities of dealing in securities and providing custodial services for securities. While IFPL has made every effort to ensure the independence of the report's contents, IFPL's nature of business is such that IFPL and its connected and associated entities together with their respective directors, officers and staff may be involved in providing dealing or investment-related services in the abovementioned securities, and have taken or may take positions in the securities mentioned in this report, and may also act as the principal for any buy or sell trades.