


' fill='%23fff' stroke='%23707070' d='M0 0h21.6v21.6H0z'/%3e%3c/clipPath%3e%3cclipPath id='c'%3e%3cpath data-name='Rectangle 6531' transform='translate(-6319 -2048)' fill='%23fff' stroke='%23707070' d='M0 0h43.2v21.6H0z'/%3e%3c/clipPath%3e%3cclipPath id='a'%3e%3cpath d='M0 0h21.6v21.6H0z'/%3e%3c/clipPath%3e%3c/defs%3e%3cg data-name='Malaysia -Square' clip-path='url(%23a)'%3e%3cpath fill='%23fff' d='M0 0h21.6v21.6H0z'/%3e%3cg data-name='Mask Group 325' transform='translate(6348 2048)' clip-path='url(%23b)'%3e%3cg data-name='Mask Group 324' transform='translate(-35)' clip-path='url(%23c)'%3e%3cg data-name='Group 21195'%3e%3cpath data-name='Path 14718' d='M-6319-2048h43.2v21.6h-43.2z' fill='%23fff'/%3e%3cpath data-name='Path 14719' d='M-6317.457-2047.229h41.657m0 3.086h-41.657m0 3.086h41.657m0 3.086h-41.657' fill='none' stroke='%23c00' stroke-width='1.543'/%3e%3cpath data-name='Path 14720' d='M-6319-2048h21.6v13.114h-21.6z' fill='%23006'/%3e%3cpath data-name='Path 14721' d='M-6319-2034.886h43.2m0 3.086h-43.2m0 3.086h43.2' fill='none' stroke='%23c00' stroke-width='1.543'/%3e%3c/g%3e%3cpath data-name='Path 14722' d='M-6302.5-2045.686l.344 2.353 1.331-1.967-.714 2.269 2.054-1.2-1.626 1.731 2.372-.19-2.218.858 2.218.858-2.372-.19 1.626 1.736-2.054-1.2.714 2.269-1.331-1.97-.344 2.358-.344-2.353-1.331 1.97.714-2.269-2.054 1.2 1.626-1.737-2.372.19 2.218-.858-2.218-.859 2.372.19-1.626-1.736 2.054 1.2-.714-2.267 1.331 1.97zm-1.929.1a4.114 4.114 0 100 7.521 4.629 4.629 0 110-7.521z' fill='%23fc0'/%3e%3c/g%3e%3c/g%3e%3c/g%3e%3c/svg%3e "malaysiaIcon")
'%3e%3cpath fill='%23fff' d='M0 0h21.6v21.6H0z'/%3e%3cg data-name='067-hong-kong'%3e%3cpath data-name='Rectangle 6488' fill='%23d80027' d='M0 0h22v22H0z'/%3e%3cg data-name='Group 21086' fill='%23f0f0f0'%3e%3cpath data-name='Path 14432' d='M11.911 8.264c-.248 1.032-.689.835-.905 1.735a2.373 2.373 0 011.109-4.614c-.429 1.803.018 1.956-.204 2.879z'/%3e%3cpath data-name='Path 14433' d='M8.606 9.029c.9.555.581.913 1.37 1.4a2.373 2.373 0 01-4.045-2.481c1.577.964 1.866.586 2.675 1.081z'/%3e%3cpath data-name='Path 14434' d='M8.311 12.409c.807-.689 1.048-.271 1.752-.871a2.373 2.373 0 11-3.609 3.081c1.408-1.202 1.136-1.594 1.857-2.21z'/%3e%3cpath data-name='Path 14435' d='M11.435 13.734c-.406-.98.066-1.08-.287-1.935a2.373 2.373 0 111.815 4.385c-.708-1.71-1.165-1.573-1.528-2.45z'/%3e%3cpath data-name='Path 14436' d='M13.66 11.173c-1.058.083-1.007-.4-1.929-.325a2.373 2.373 0 114.731-.371c-1.846.145-1.856.621-2.802.696z'/%3e%3c/g%3e%3c/g%3e%3c/g%3e%3c/svg%3e "hongKongIcon")


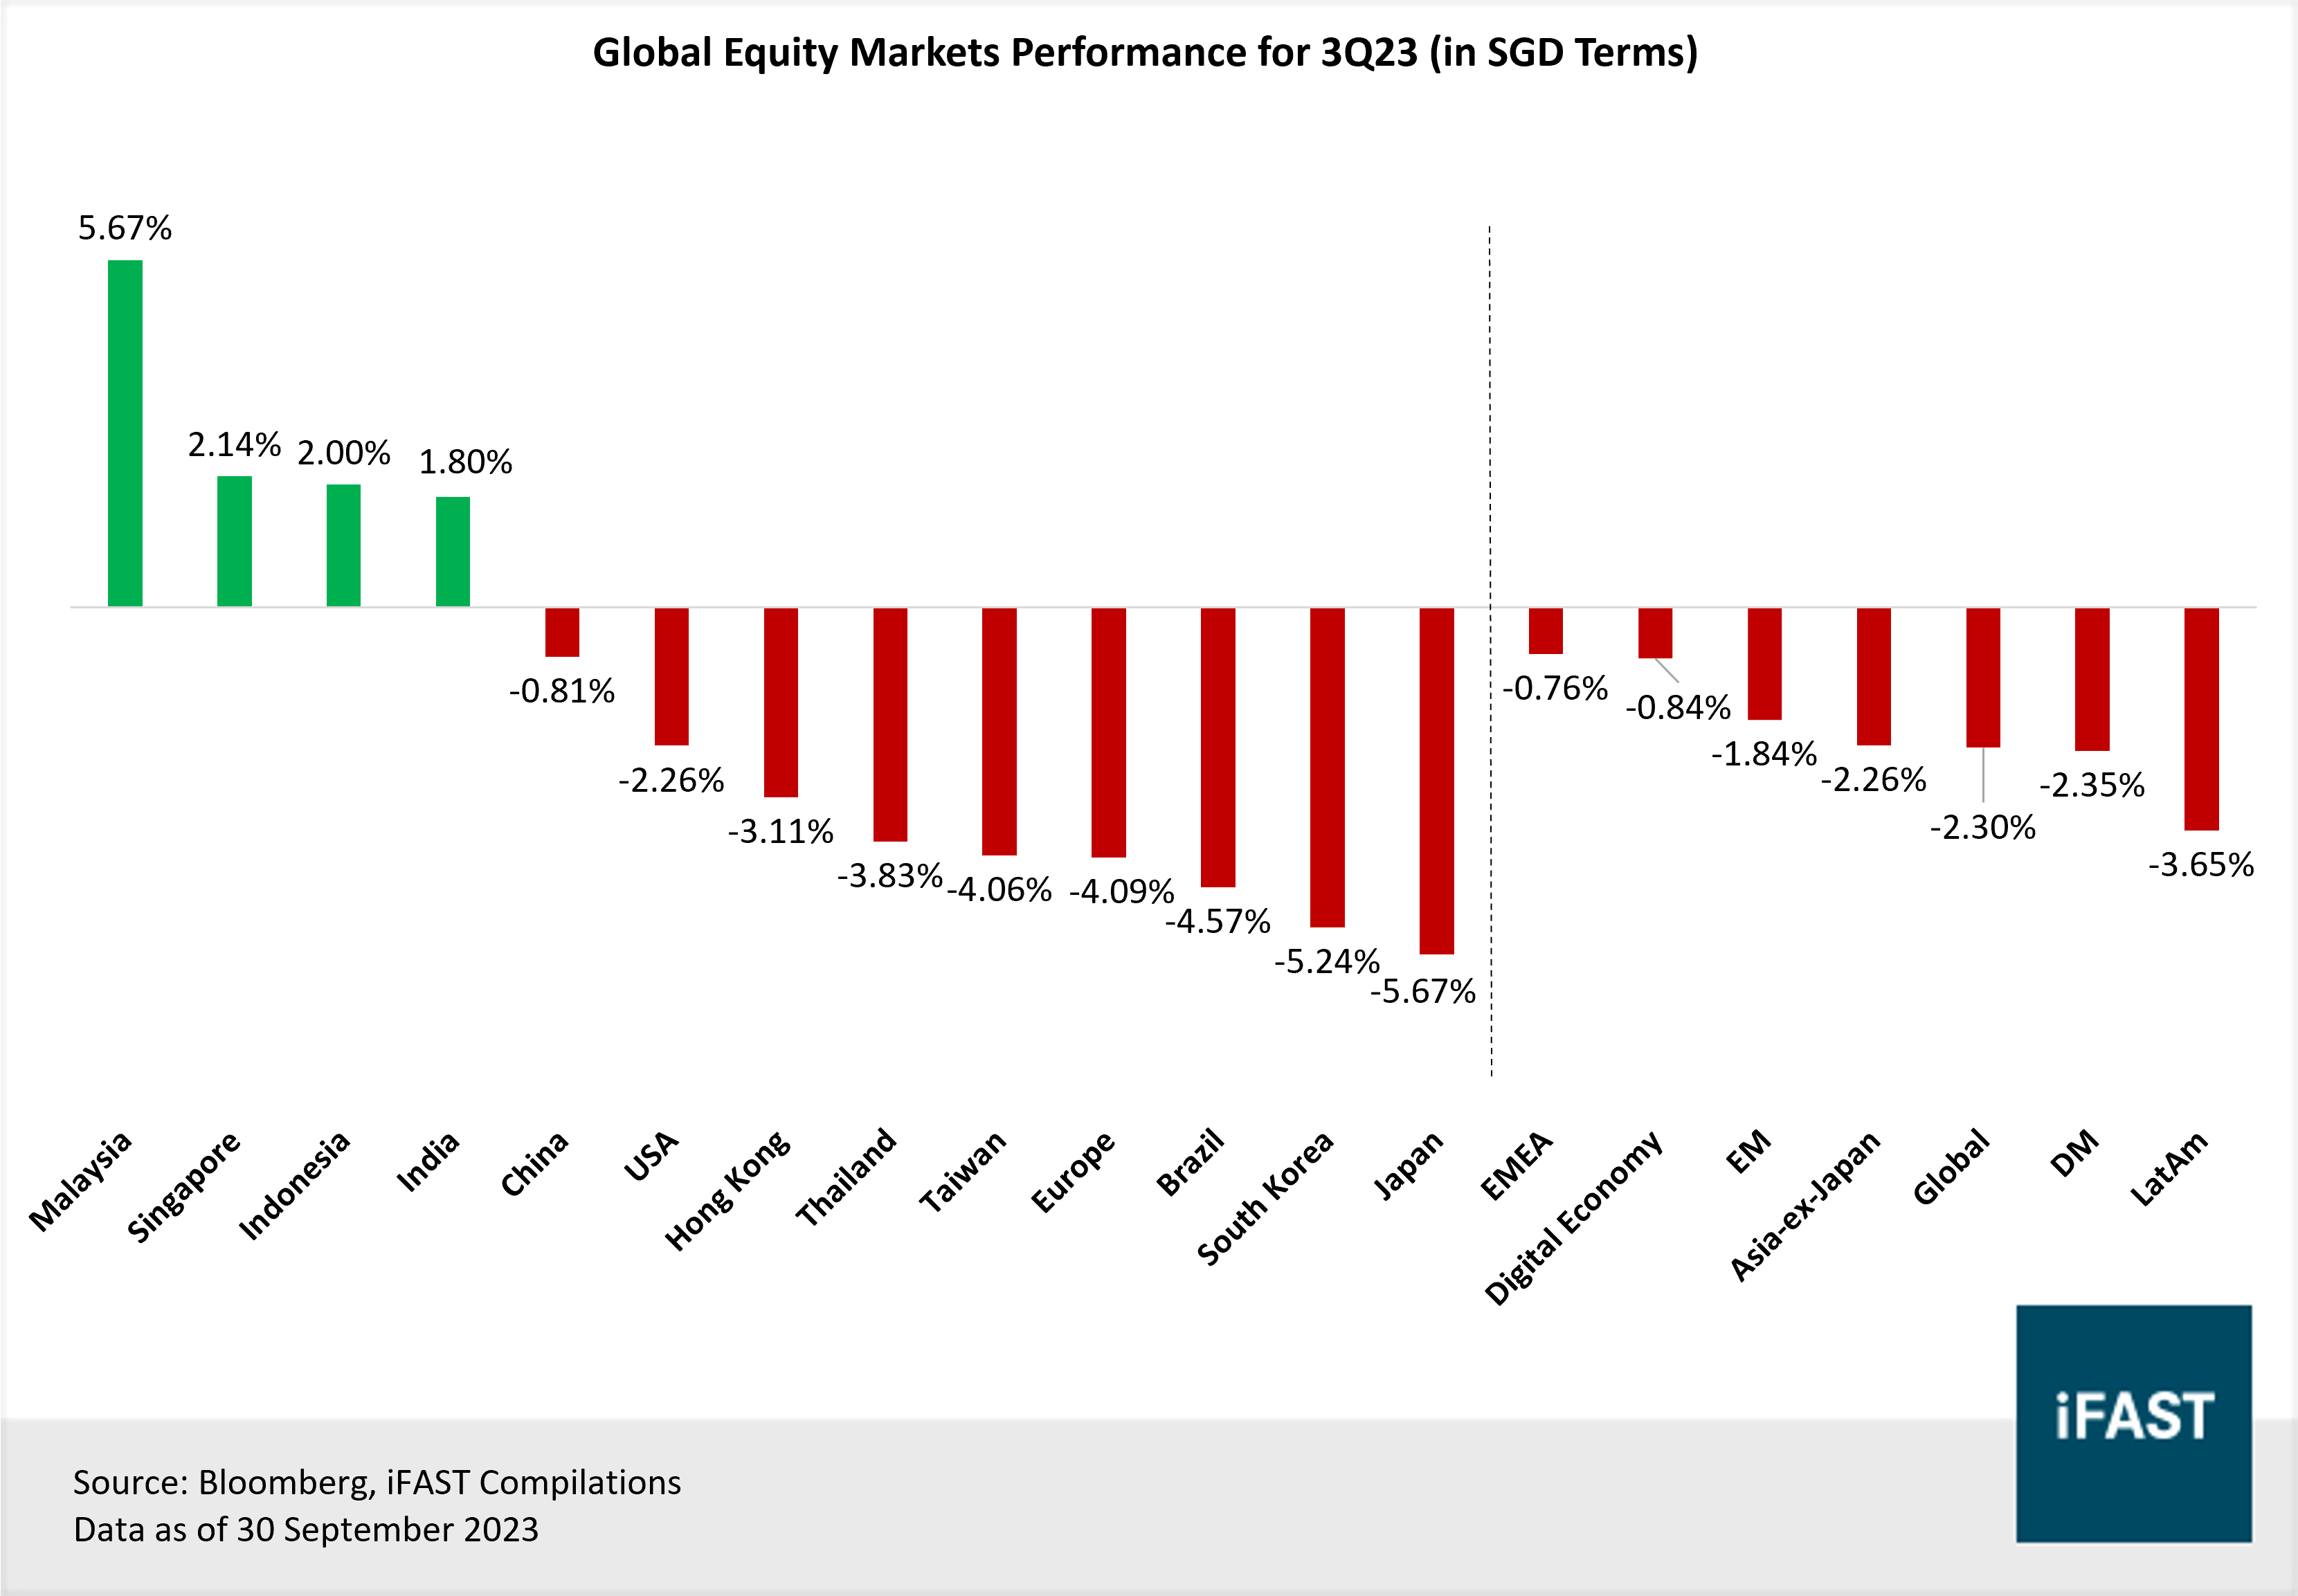
• Global equities pulled back in 3Q23 after a strong performance in the previous quarter, with the MSCI ACWI Index losing -2.30% (in SGD terms).
• Malaysia: Confidence in Malaysia’s equity market would likely be revived by political certainty, clear monetary and fiscal policies, as well as attractive valuations.
• Singapore: The anticipated rebound in exports growth and recovery in the semiconductor industry, coupled with earnings growth within the financial sector would propel the Singapore equity market higher.
• Japan: Improving corporate governance, profit margins, strong earnings growth and attractive valuations compared to other developed market peers makes Japan our favourite equity market.
• South Korea: There are increasingly signs that we are approaching the trough of this semiconductor downcycle, which would significantly boost South Korea’s economy given its large reliance for exports and the manufacturing sector as the chip industry recovers.
After a strong performance in 2Q23, equity markets generally faded and pulled back in 3Q23. Majority of the equity markets across both developed and developing markets were in the red, with the MSCI ACWI index declining by -2.30% (in SGD terms) in 3Q23.
On a single market level, the best performing markets in 3Q23 (in SGD terms) were Malaysia (+5.67%) and Singapore (+2.14%). On the other spectrum, the bottom performing markets were Japan (-5.67%) and South Korea (-5.24%).
Figure 1: 3Q23 global equities performance ranked (regions under coverage)
Malaysia (+5.67% in SGD terms)
What drove 3Q23 performance?
Malaysia’s equity market performed well in 3Q23, having risen by +5.67% (in SGD terms), as investor sentiments improved with the easing of political uncertainty following the conclusion of state elections. Meanwhile, inflation also trended downwards and the Malaysian central bank has signalled that it would hold its policy rate at 3%, adopting a similar stance to most of its Asian peers.
Equity outlook:
As political uncertainty eases, investor confidence is likely to improve, and this could play an important role in attracting further investment into the nation’s market. Furthermore, stabilising monetary policy and a clearer direction in its fiscal stance are also providing more certainty for investors. Lastly, on a valuation basis, Malaysian equities looks attractive, as the FBMKLCI Index is currently trading well below its historical 5-year average PE of 16X based on its expected 2025 EPS. On top of that, investors can also enjoy a forward dividend yield of 4.8% by the end of 2025.
Related article: Malaysia Outlook: Time to regain focus?
Figure 2: FBMKLCI Index price vs EPS chart
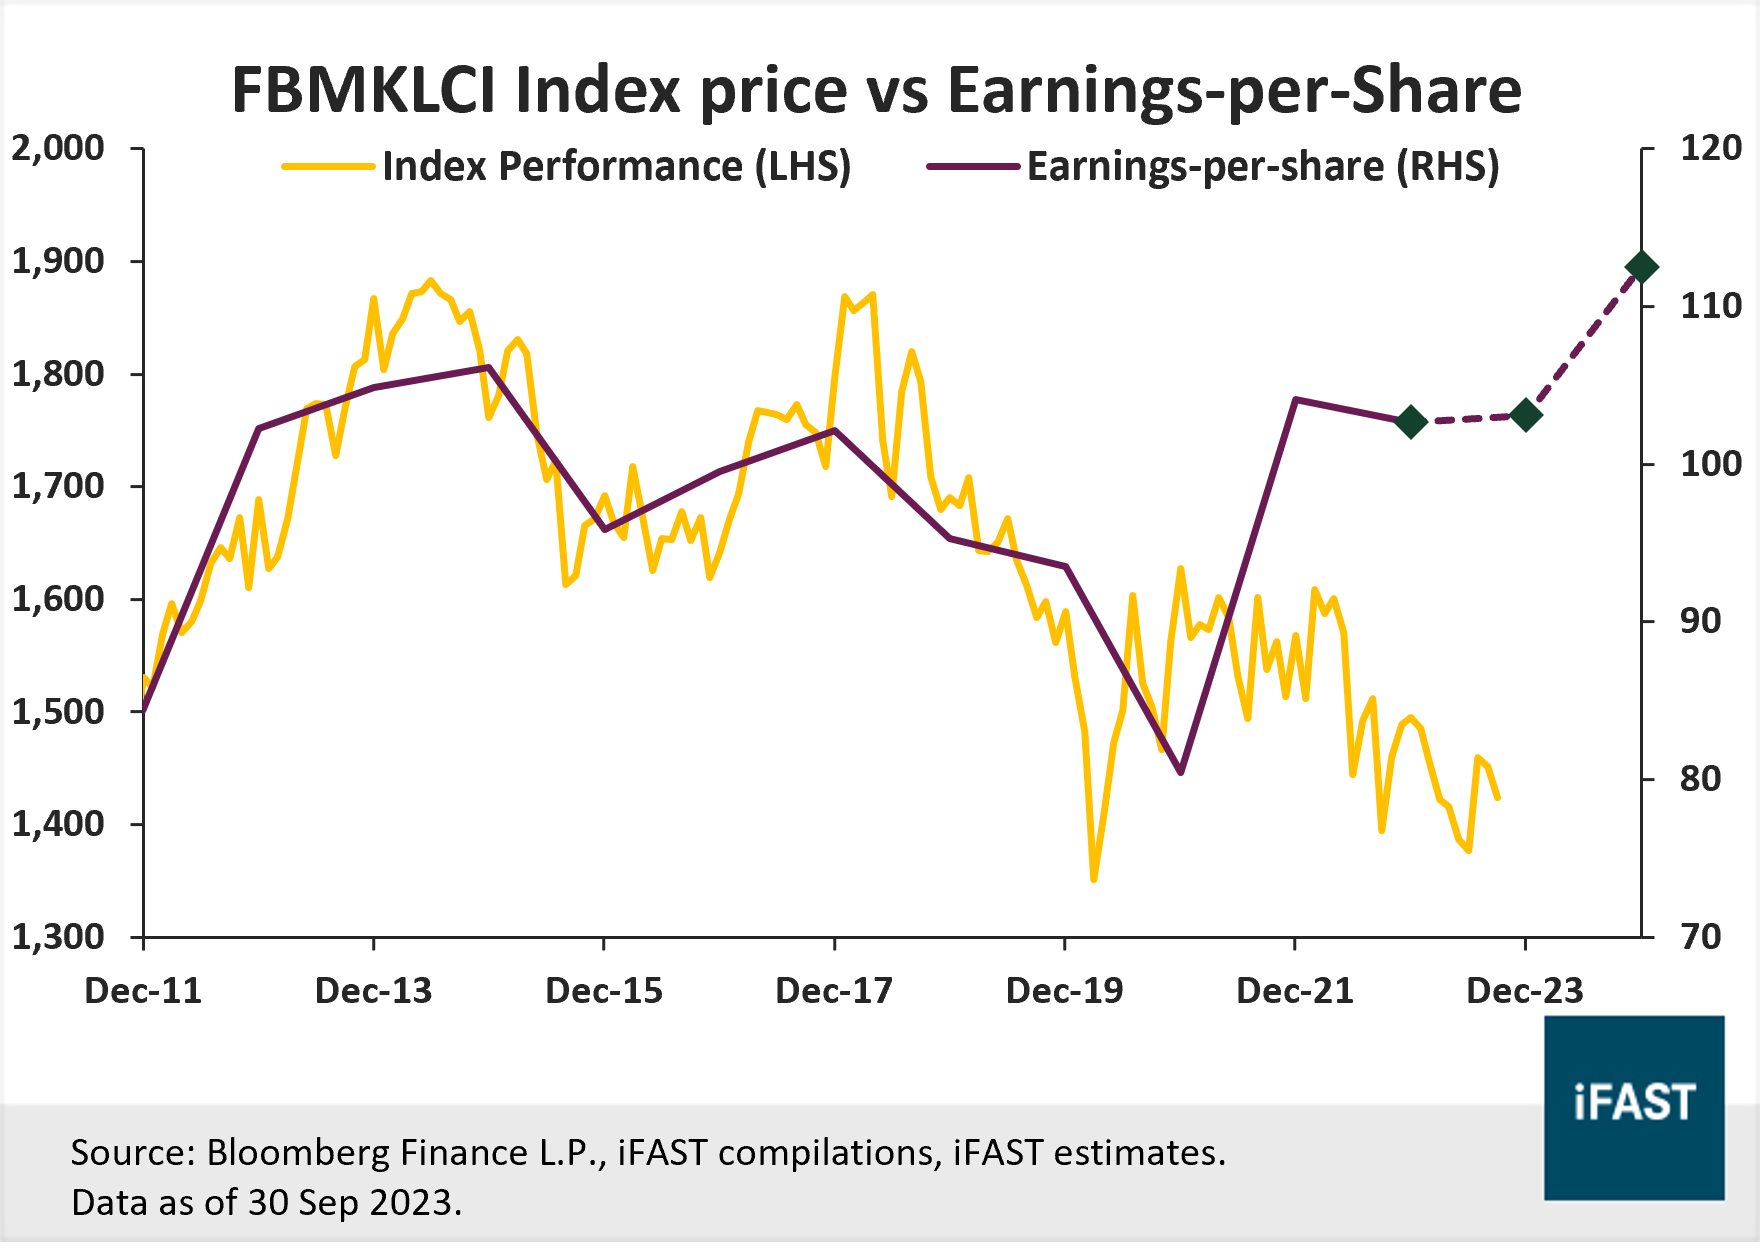
Table 1: EPS and projections for FBMKLCI Index
|
Malaysia (FBMKLCI Index) |
2022 |
2023E |
2024E |
2025E |
|
PE Ratio (X) |
15.0 |
13.8 |
12.7 |
11.8 |
|
Earnings Growth |
9.2% |
8.4% |
9.1% |
6.8% |
|
EPS |
95.14 |
103.1 |
112.53 |
120.19 |
|
Target Price (Based on fair PE ratio of 16X) |
- |
- |
- |
1,920 |
|
Upside |
- |
- |
- |
34.8% |
|
Source:
Bloomberg Finance L.P., iFAST Compilations. |
||||
Table 2: Recommended products
|
ETF |
Unit Trusts |
|
|
Malaysia |
Singapore (+2.14% in SGD terms)
What drove 3Q23 performance?
Singapore’s equity market also performed relatively well this quarter, gaining +2.14% (in SGD terms). Financials, which makes up about 50% of the index, had rallied after pulling back in the previous two quarters.
Equity outlook:
Looking ahead, we believe Singapore’s economy will rebound in the next six to twelve months, supported by a rebound in exports growth and a recovery in the semiconductor industry. Beyond which, various sectors within the STI also have several tailwinds, which would help to propel the index higher.
For instance, even though banks are approaching peak net interest margins and are currently experiencing slowing loan growth, non-interest income recovery and higher wealth management fees with the influx of new money and family offices are tailwinds for the sector.
Meanwhile, it is important for investors to be selective within the REITs sector, as current estimates may be overly optimistic given that some of these companies have yet to refinance their loans, and higher interest rates also means they are more prone to a decrease in property valuation. Within the S-REITs sector, we prefer REITs that operate in the hospitality, data centre and logistics space.
Figure 3: STI Index price vs EPS chart
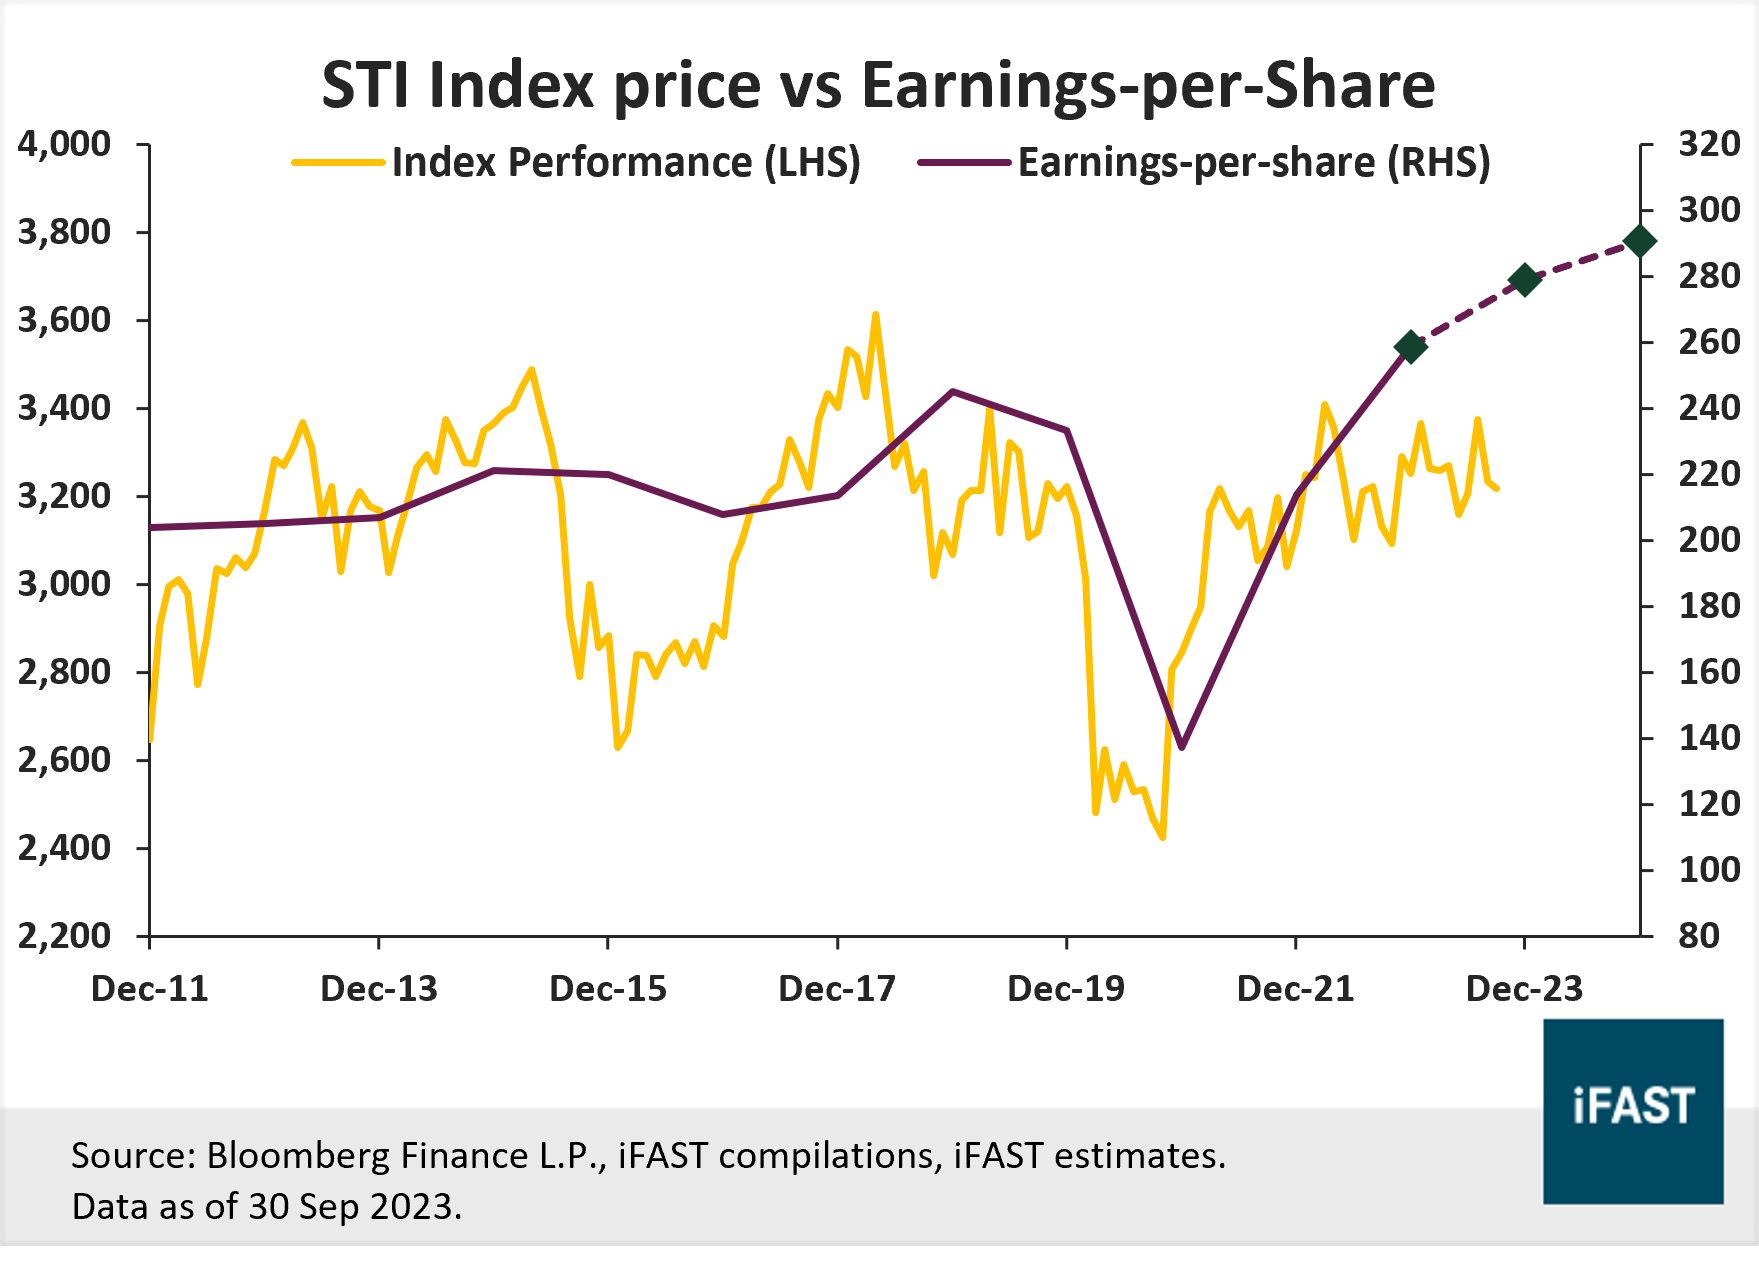
Table 3: EPS and projections for STI Index
|
Singapore (STI Index) |
2022 |
2023E |
2024E |
2025E |
|
PE Ratio (X) |
5.7 |
5.5 |
5.1 |
4.9 |
|
Earnings Growth |
9.2% |
11.8% |
5.5% |
6.7% |
|
EPS |
248.8 |
258.7 |
278.9 |
290.60 |
|
Target Price (Based on fair PE ratio of 16X) |
- |
- |
- |
4,070 |
|
Upside |
- |
- |
- |
26.5% |
|
Source:
Bloomberg Finance L.P., iFAST Compilations. |
||||
Table 4: Recommended products
|
ETF |
Unit Trusts |
|
|
Singapore |
Japan (-5.67% in SGD terms)
What drove 3Q23 performance?
After a blistering rally in the first half of the year, Japan’s equity market has started to cool down, declining by -5.67% in 3Q23 (in SGD terms). This was likely driven by negative global sentiments that interest rates are expected to remain higher-for longer, and a surge in bond yields that have made holding equities less attractive.Equity outlook:
Despite the recent pullback, we continue to remain positive on Japanese equities due to improving corporate governance, strong earnings growth and the potential for Japan to re-emerge as a semiconductor powerhouse. Furthermore, an improving domestic consumption and a tourism spending boost could drive a consumption-led growth, keeping the Japanese economy resilient.Moreover, as the Japanese yen is close to 10-month low, we may see a potential intervention by the authorities, causing a yen reversal. While a weaker yen has proven supportive for Japanese equities, largely through a boost in earnings from abroad, we think a stronger yen should not detract from Japanese equities’ performance, and could help quell macro risks such as the trade deficit and corporate headwinds like high import costs.
Figure 4: Nikkei 225 Index price vs EPS chart
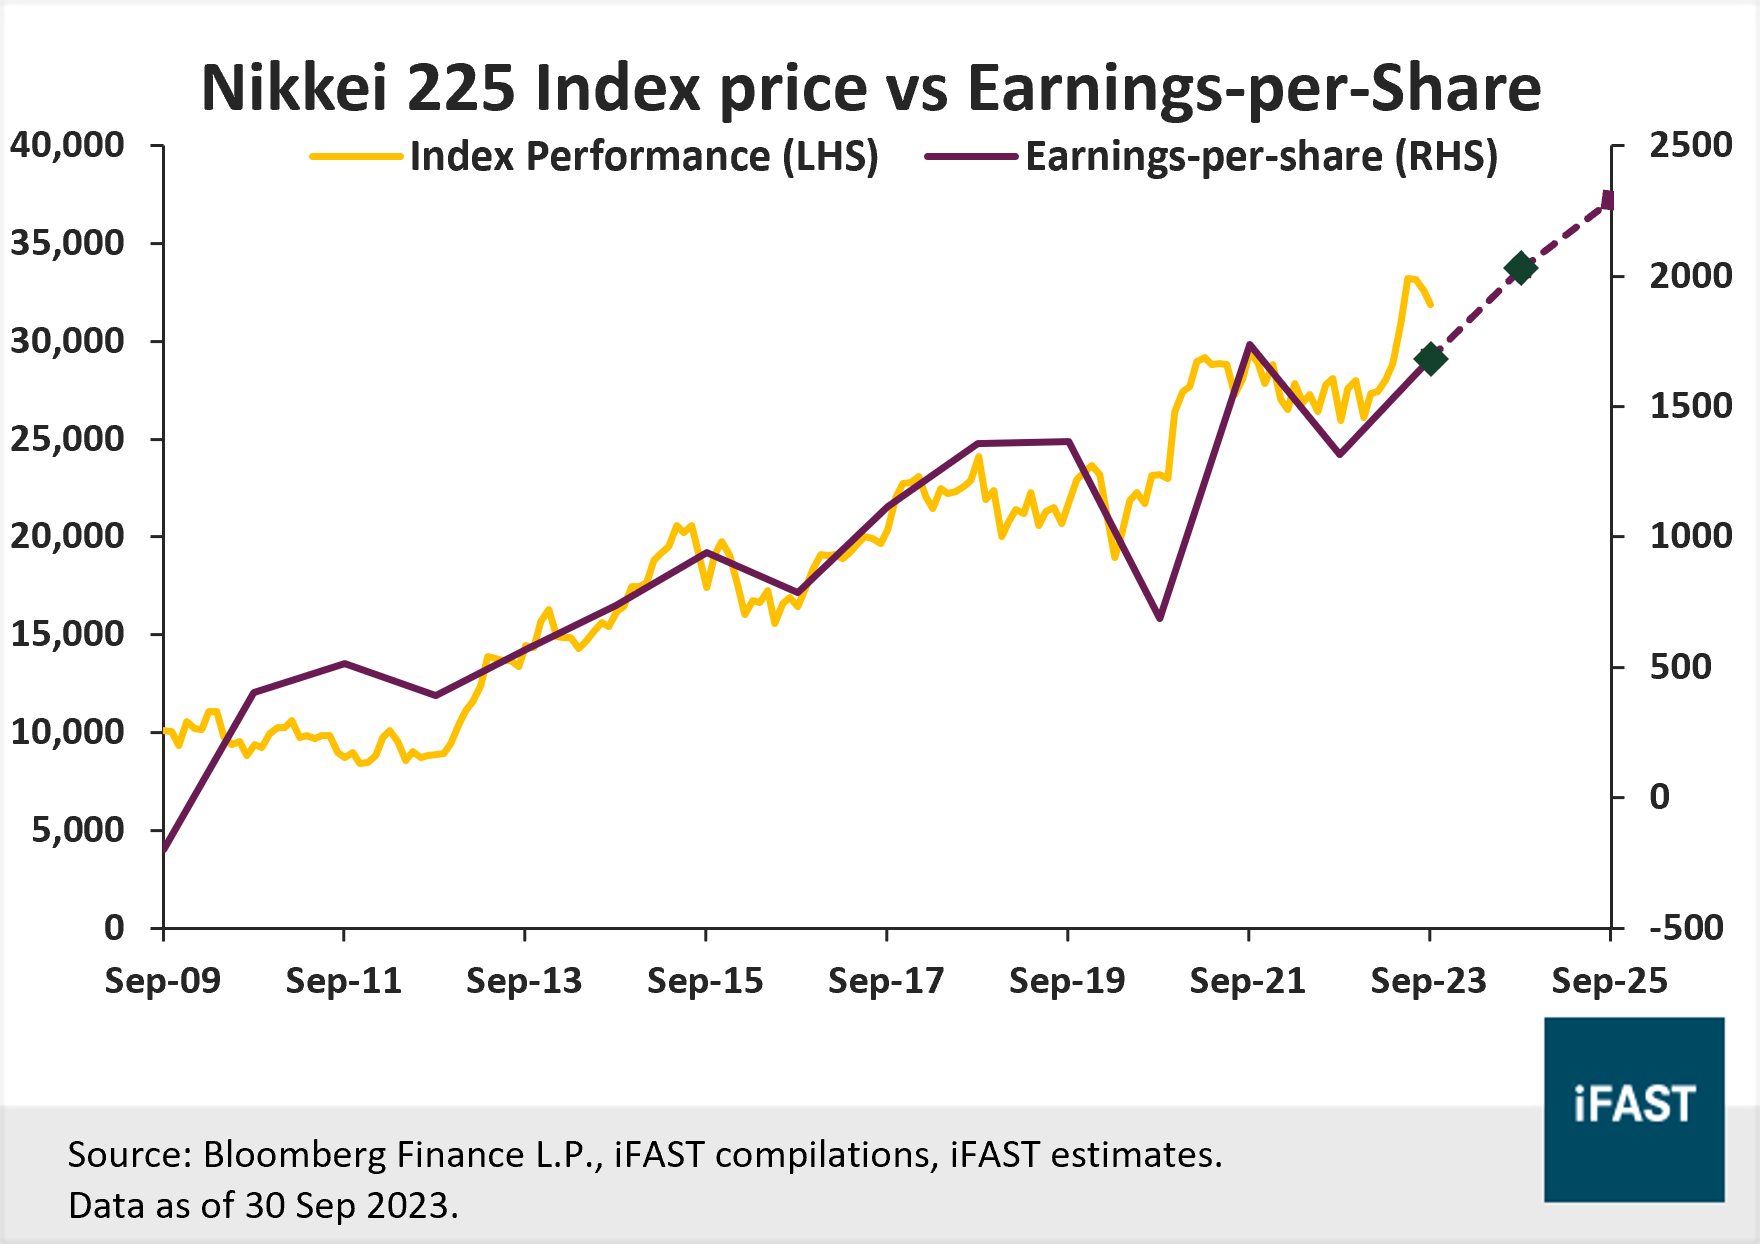
Table 5: EPS and projections for Nikkei 225 Index
|
Japan (Nikkei 225 Index) |
2022 |
2023E |
2024E |
2025E |
|
PE Ratio (X) |
24.2 |
18.9 |
15.7 |
13.9 |
|
Earnings Growth |
-24.3% |
28.0% |
20.5% |
12.9% |
|
EPS |
1,316 |
1,684 |
2,030 |
2,292 |
|
Target Price (Based on fair PE ratio of 18X) |
- |
- |
- |
41,270 |
|
Upside |
- |
- |
- |
29.5% |
|
Source:
Bloomberg Finance L.P., iFAST Compilations. |
||||
Table 6: Recommended products
|
ETF |
Unit Trusts |
|
|
Japan |
South Korea (-5.24% in SGD terms)
What drove 3Q23 performance?
Equity outlook:
There are increasing signs that we are approaching the trough of this semiconductor downcycle, and a subsequently recovery would significantly boost South Korea’s economy given its large reliance for exports and the manufacturing sector.
Some of the largest holdings within the KOSPI Index includes Samsung and SK Hynix, which together account for roughly 25% of the entire index. Therefore, investors who are keen to ride on the semiconductor upcycle recovery could look towards Korea’s equity market, especially when valuations for Korean equities remain attractive. Over the longer term, the technological dominance of South Korean semiconductor companies would give them a competitive edge in the global market, especially with the on-going US-China tensions.
Figure 5: KOSPI Index price vs EPS chart
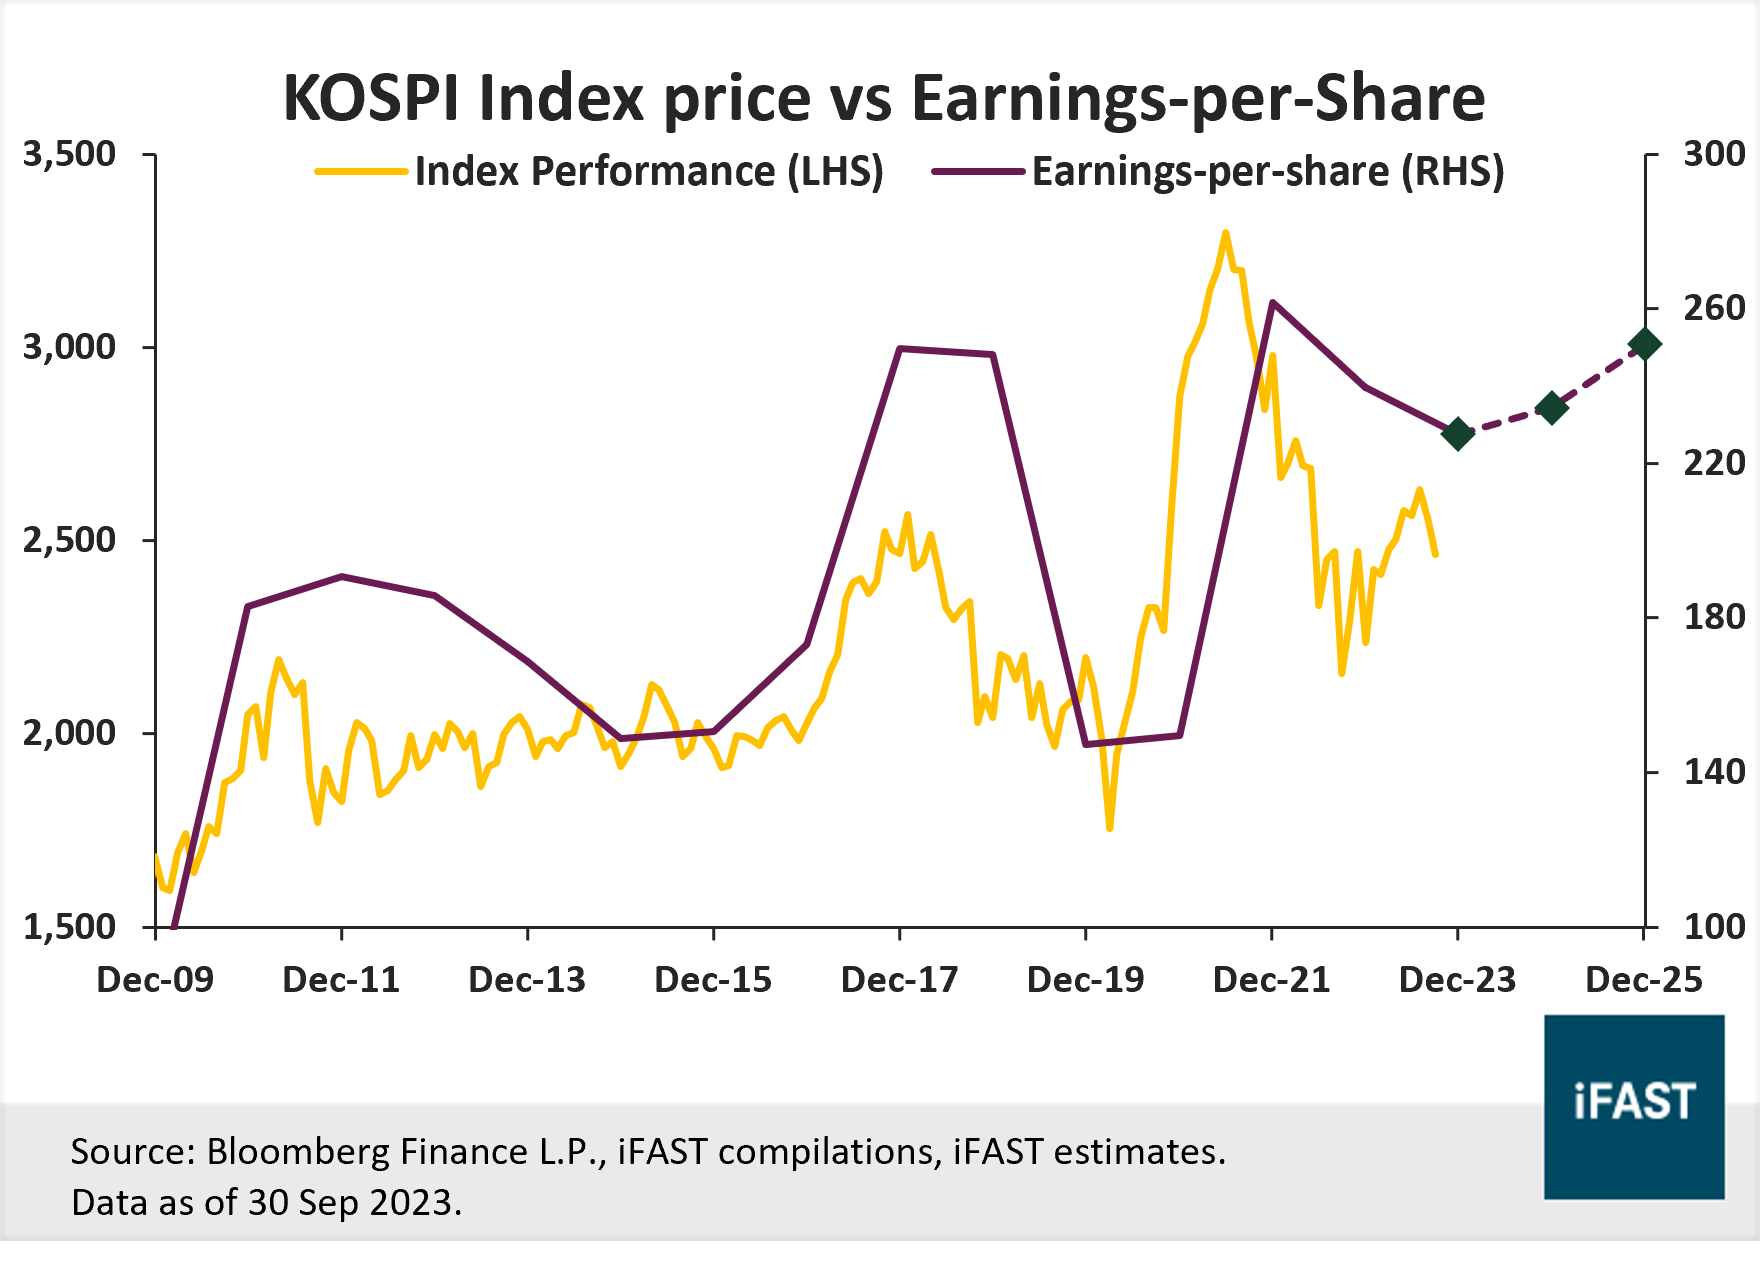
Table 7: EPS and projections for KOSPI Index
|
South Korea (KOSPI Index) |
2022 |
2023E |
2024E |
2025E |
|
PE Ratio (X) |
10.7 |
14.4 |
10.0 |
8.7 |
|
Earnings Growth |
-4.0% |
-25.3% |
43.0% |
16.0% |
|
EPS |
229.94 |
171.7 |
245.53 |
284.82 |
|
Target Price (Based on fair PE ratio of 12X) |
- |
- |
- |
3420 |
|
Upside Potential |
- |
- |
- |
38.7% |
|
Source:
Bloomberg Finance L.P., iFAST Compilations. |
||||
Table 8: Recommended products
|
ETF |
Unit Trusts |
|
|
South Korea |
For specific disclosure, at the time of publication of this report, IFPL (via its connected and associated entities) and the analyst who produced this report hold a NIL position in the abovementioned securities.

' d='M0 0h300v57H0z'/%3e%3c/svg%3e "sgFsmLogoEnIcon")


'%3e%3cpath fill='%23fff' d='M0 0h21.6v21.6H0z'/%3e%3cg data-name='141-singapore'%3e%3cpath data-name='Rectangle 6502' fill='%23f0f0f0' d='M0 0h22v22H0z'/%3e%3cpath data-name='Rectangle 6503' fill='%23d80027' d='M0 0h22v10H0z'/%3e%3cg data-name='Group 21092' fill='%23f0f0f0'%3e%3cpath data-name='Path 14455' d='M2.917 5.365A3.128 3.128 0 015.374 2.31a3.128 3.128 0 100 6.11 3.128 3.128 0 01-2.457-3.055z'/%3e%3cpath data-name='Path 14456' d='M6.939 2.46l.222.683h.718l-.581.422.222.683-.581-.422-.581.422.222-.683-.581-.422h.718z'/%3e%3cpath data-name='Path 14457' d='M5.193 3.801l.222.683h.718l-.581.422.222.683-.581-.422-.581.422.222-.683-.581-.422h.718z'/%3e%3cpath data-name='Path 14458' d='M8.68 3.801l.222.683h.718l-.581.422.222.683-.581-.422-.581.422.222-.683-.581-.422h.718z'/%3e%3cpath data-name='Path 14459' d='M8.01 5.811l.222.683h.718l-.581.422.222.683-.581-.422-.581.422.222-.683-.581-.422h.718z'/%3e%3cpath data-name='Path 14460' d='M5.863 5.811l.222.683h.718l-.581.422.222.683-.581-.422-.581.422.222-.683-.581-.422h.718z'/%3e%3c/g%3e%3c/g%3e%3c/g%3e%3c/svg%3e "singaporeIcon")


' d='M0 0h67v14H0z'/%3e%3c/svg%3e "msFooterLogoIcon")
