Our fixed income views for 2025
- Sticking with short duration bonds. Look to add duration when yield curve normalises
- Positive on investment grade bonds. Pocket high-quality bonds at appealing yields
- Stay selective for high-yield bonds. Hidden gems across the Asian HY bond space
- Staying neutral on emerging market debt
- Positive on short-term US/ Singapore treasury bills and medium-term Malaysian treasury notes
As the curtain closes in 2024, major fixed income markets can look back on a year of decent recovery. The combination of a resilient global economy, easing monetary policy, and demand for higher yields acted as drivers, fuelling the compression of credit spreads. This compression was the key driver of returns that supported major fixed income market performances for most of the year.
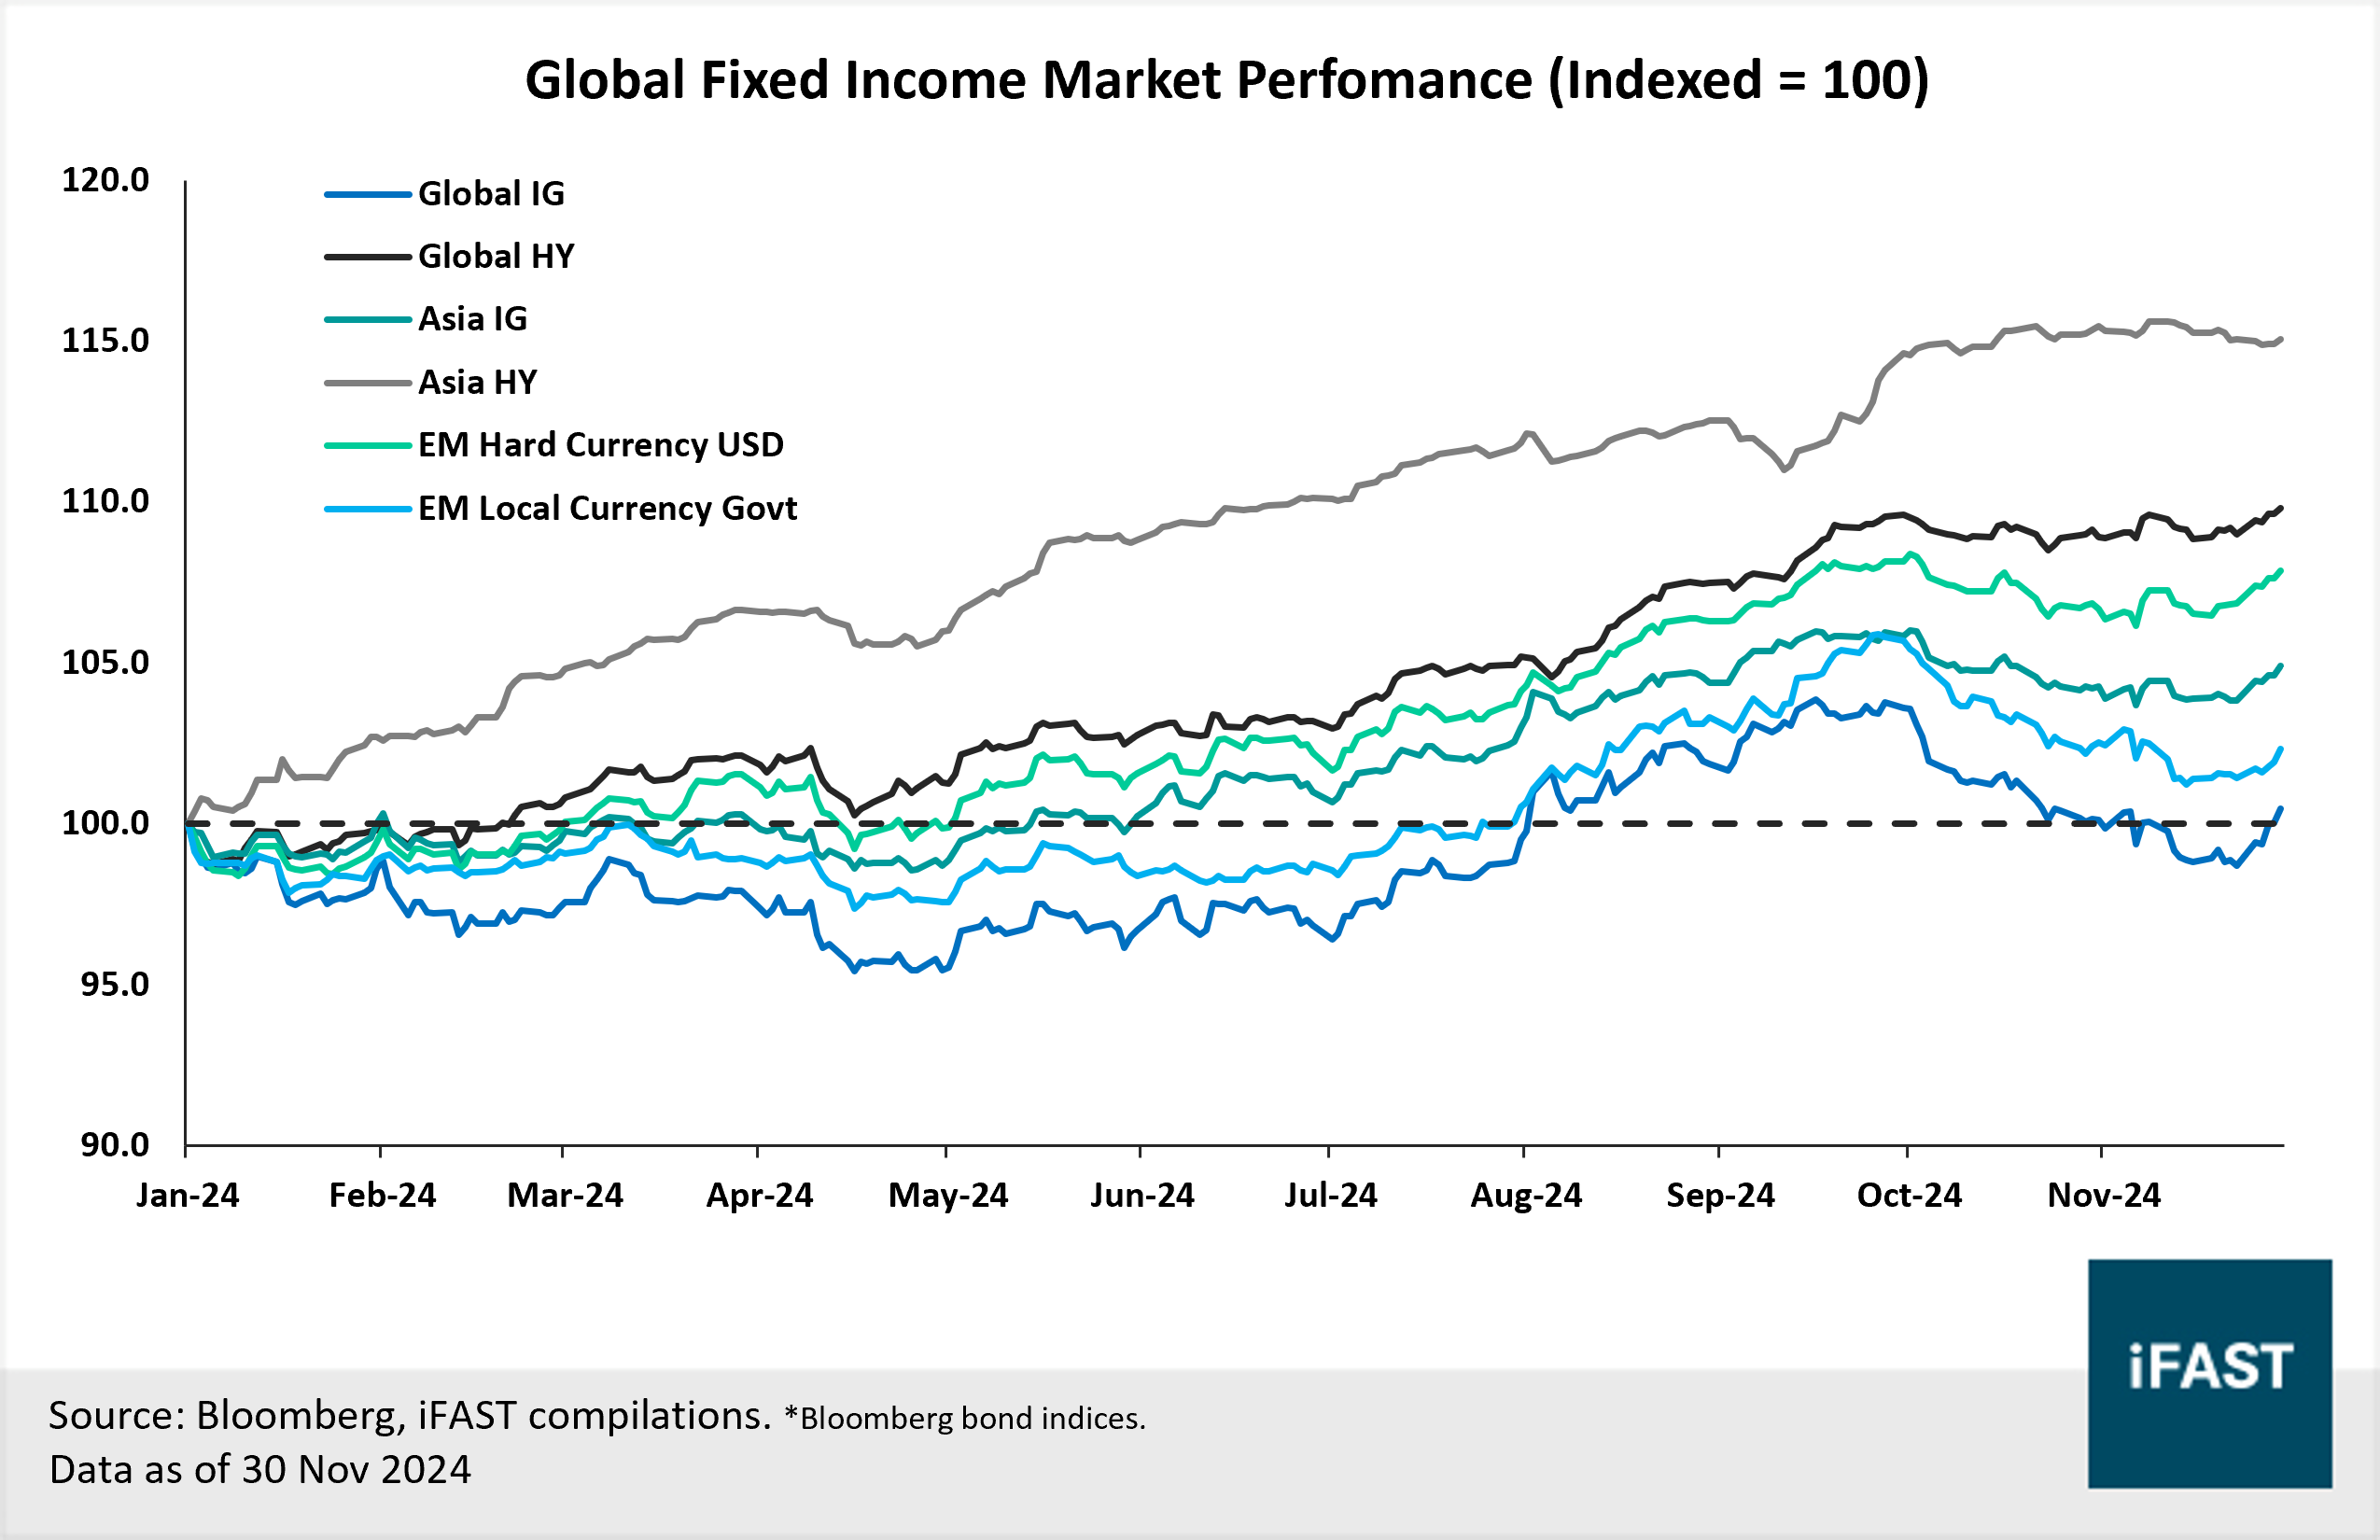
However, the path of recovery was no easy feat. Global sovereign yields fluctuated wildly as markets walked back on overly optimistic expectations of Fed cuts, injecting volatility across the bond space. Despite this, major fixed income markets managed to generate positive returns. Asia high-yield bonds were the top performer, returning 15.1% year-to-date on an index level. The other top-performing segments include global high yield and EM hard currency bonds which returned 9.8% and 7.9% respectively in the same period (all returns are as of 30 November, local currency terms).
With 2024 soon to be in the rear-view mirror, we look ahead and remain optimistic about the outlook for fixed income. The global rate hike cycle is over as policymakers are warming up to the idea of further rate cuts, yet nominal yields remain broadly appealing across the bond space. Meanwhile, credit spreads remain supported by a resilient global growth backdrop and robust demand for yield. Setting our sights forward, we outline our thoughts on global rates and share our fixed income markets views for 2025 in this article.
Chart 1: Major fixed income markets have generated positive returns and continued to recover in 2024.
1. Sticking with short duration bonds. Look to add duration when yield curve normalises
In our view, global benchmark rates will likely remain high in 2025 despite rate cuts across major central banks. Anchored by our macro view of a resilient US labour market and bumpy descent in inflation next year, we expect the Fed to adopt a cautious stance towards rate cuts, setting the tone for other major central banks. Markets’ expectations of US longer-term real inflation have also climbed from the 2.0% level, reinforcing the case for the Fed to keep policy restrictive.
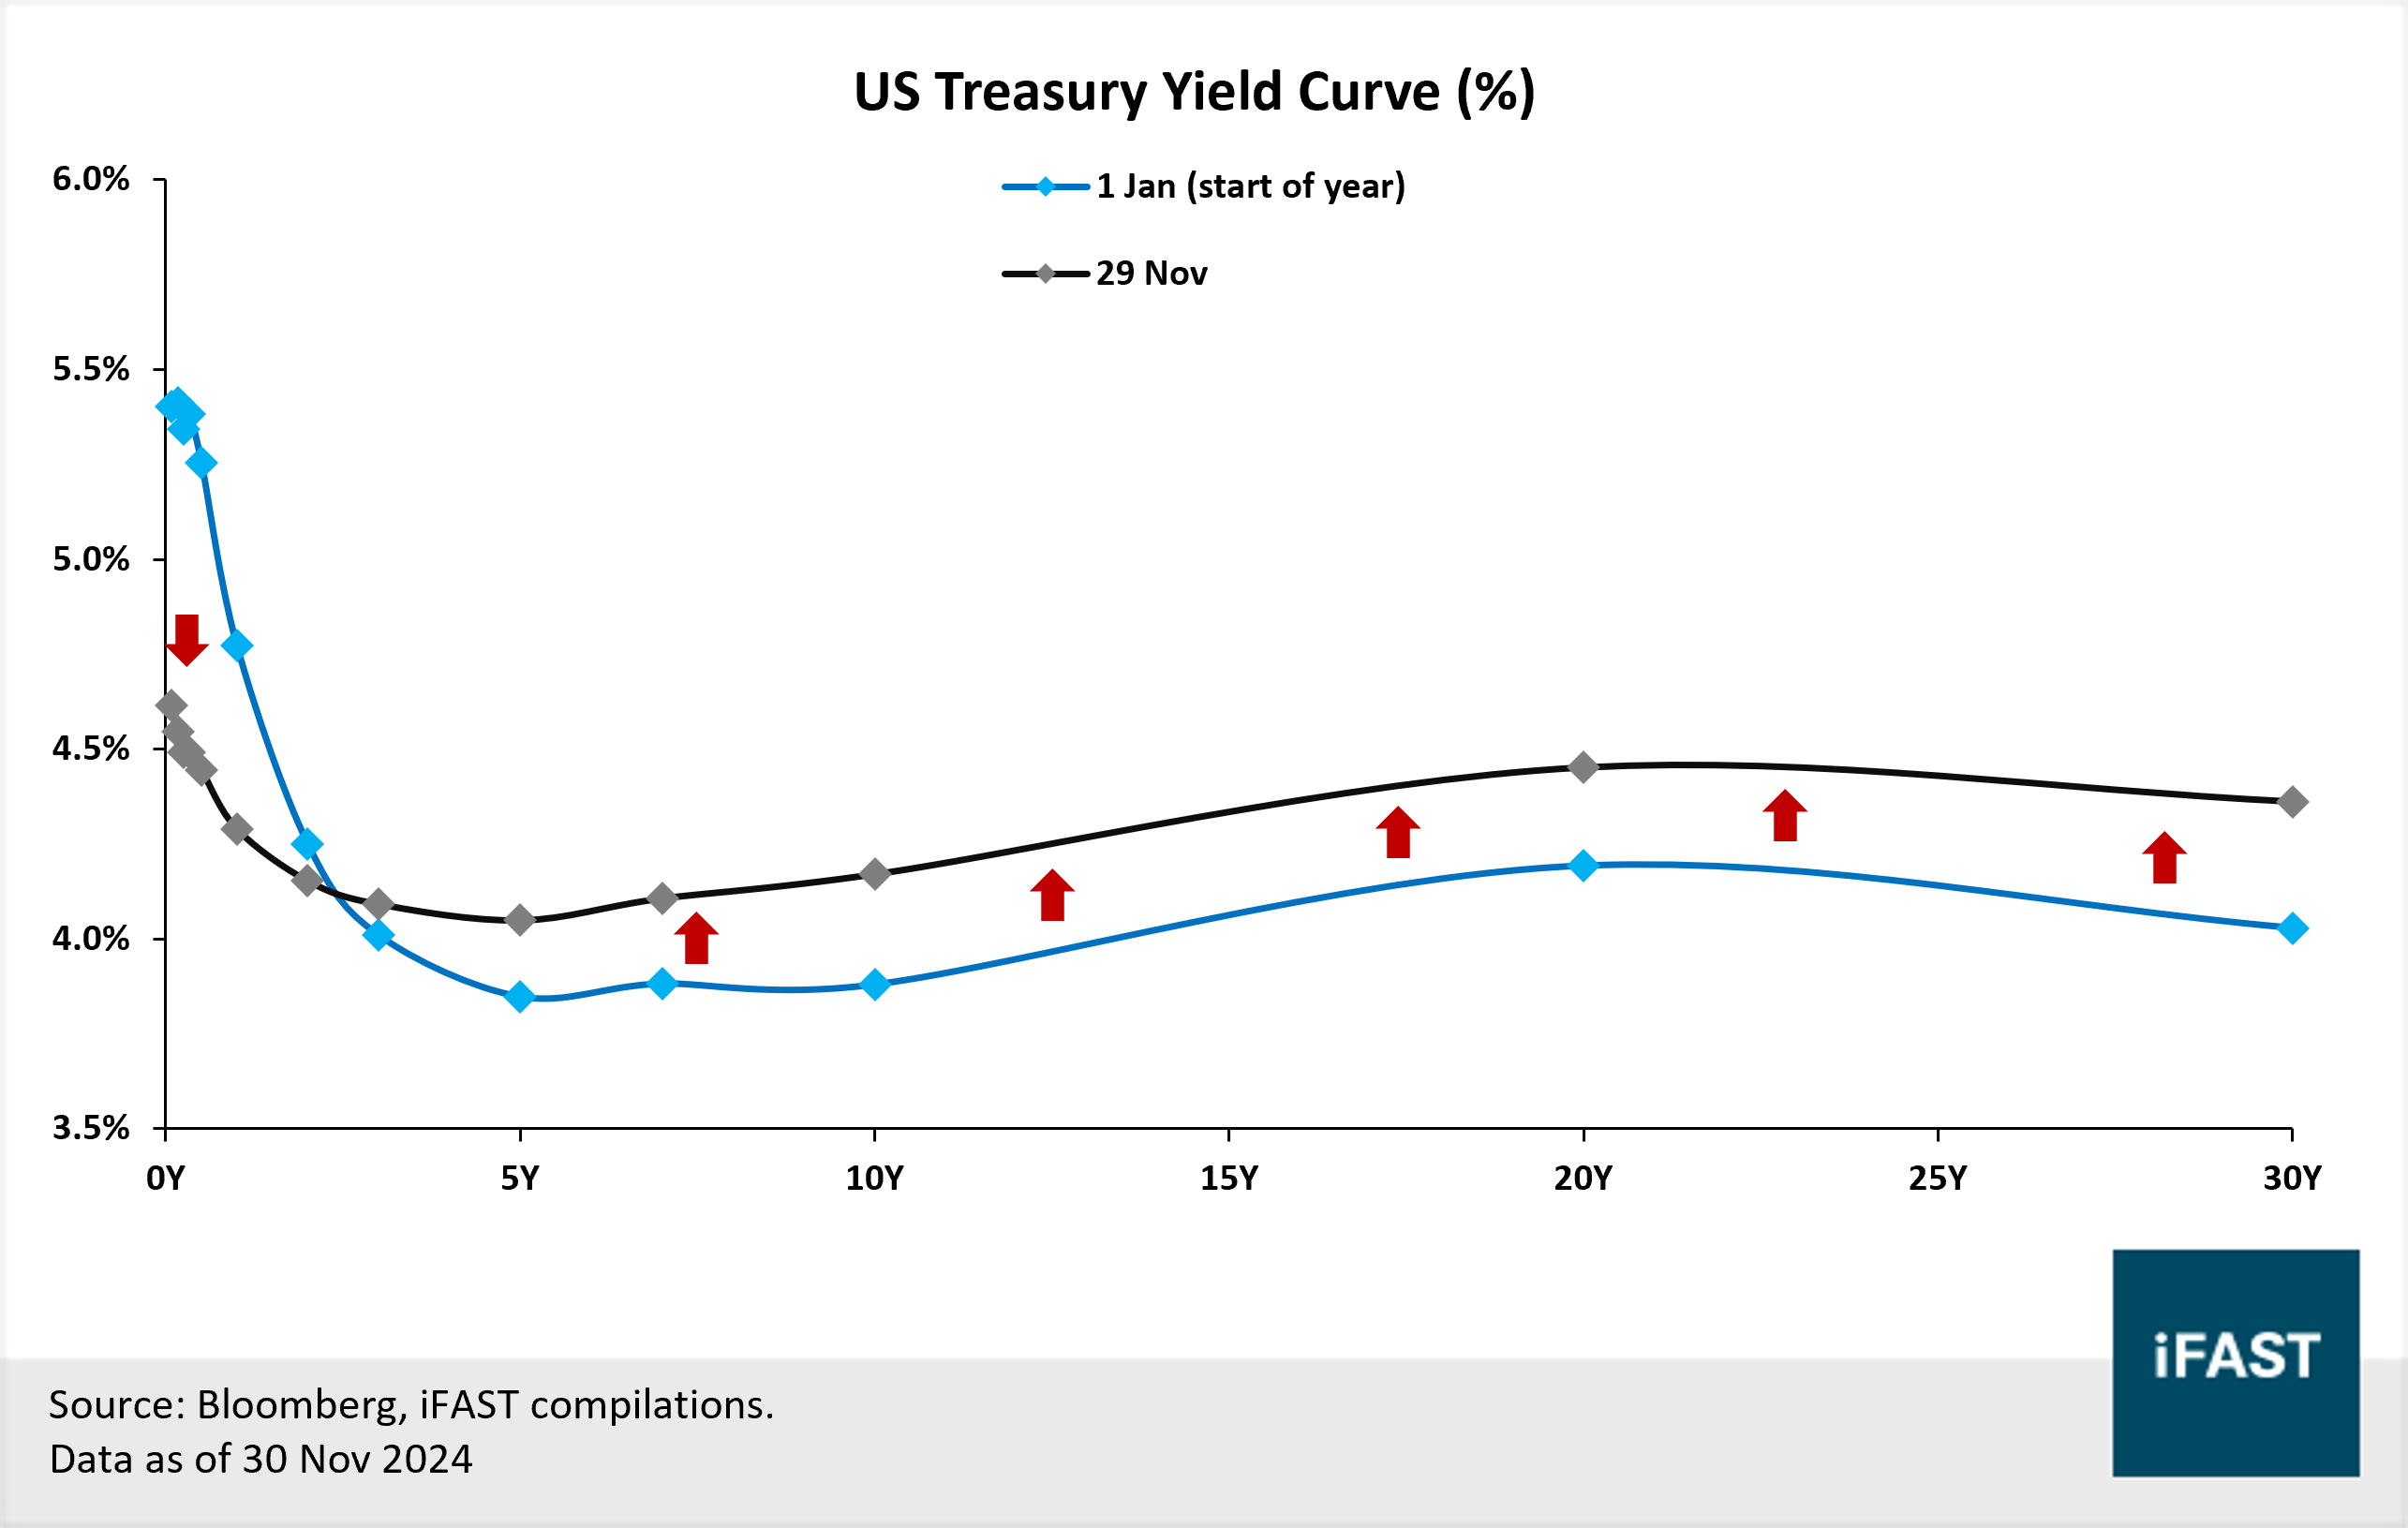
Major sovereign curves have continued to normalise in 2024, transitioning away from a deeply inverted state, as short-end yields dipped with rate cuts while longer-end yields saw more muted increase (Chart 2). Given our view on rate cuts next year, we think major sovereign curves may continue to flatten in 2025, but it may take time before we see a steeper slope.
With major sovereign curves still largely inverted, coupled with our expectations of elevated global benchmark rates in 2025, we prefer to keep our duration exposure short. We see opportunities across the short duration bond space especially on the ultra-short end where the highest nominal yields can be found. That said, short-term yields are still high as compared to history, with short-term corporate bonds still offering over 4% (on an index level) amidst rate cuts (Chart 3). We think elevated yields from short duration bonds can be sustained in 2025 with policymakers being conservative towards cutting rates. Comparing yields between short and longer-term bonds, we think investors are not getting compensated sufficiently for taking on additional maturity and duration risks.
We emphasise that long-duration bonds are not guaranteed strong gains even if policymakers cut rates. As we highlighted recently, despite the Fed already cutting rates, 10y UST yields are up by +18 bps a month after the cut and +28 bps year-to-date (as of 30 Nov), with the latter reflecting further pressure from Trump’s presidential victory. An investor who bought the benchmark 10y UST at least a month before the September rate cut would be slightly in the red after one month (or even until the end of November) (Table 1). We expect limited room for long-end UST yields to decline as this would require markets to price in even more rate cuts in 2025. This may be challenging with multiple factors exerting upward pressure on UST yields such as a resilient US economy, pro-inflationary policies from Trump’s administration, and the Fed’s ongoing reduction in reserve balances.
Investors can look to turn positive on longer duration bonds when the US treasury curve steepens, and longer-term treasuries start to offer higher yields than their short-term counterparts. In terms of adding duration to their portfolios, we recommend investors reallocate gradually instead of an all-in approach (i.e. avoid a complete pivot from short to long duration bonds). Our reference rates to add duration opportunities gradually is when the 10-year UST yield approaches 4.5% - 5.0%.
Chart 2: The US treasury curve has been normalising in 2024, transitioning away from a deeply inverted state
Chart 3: Short-duration bond yields remain high despite rate cuts - Short-duration corporate bonds offer above 4% yield
Table 1: Investors betting on longer-duration bonds would have lost money even as the Fed cut rates.
|
When you decided to buy the 10Y UST
|
Time Period
(Until 1M after Sep rate hike)
|
Change in Yield
|
Price return
|
Total return
(includes coupons)
|
|
1 month before Fed meeting (16 Aug)
|
16 Aug to 18 Oct
|
+0.18%
|
-1.37%
|
-0.63%
|
|
1 week before Fed meeting (11 Sep)
|
11 Sep to 18 Oct
|
+0.43%
|
-3.19%
|
-2.73%
|
|
Right before Fed meeting (17 Sep)
|
17 Sep to 18 Oct
|
+0.44%
|
-3.24%
|
-2.84%
|
|
Source: Bloomberg Finance L.P.,
iFAST compilations. Data as of 29 Nov 2024.
|
|
When you decided to buy the 10Y UST
|
Time Period
(Until end-Nov)
|
Change in Yield
|
Price return
|
Total return
(includes coupons)
|
|
1 month before Fed meeting (16 Aug)
|
16 Aug to 29 Nov
|
+0.28%
|
-2.18%
|
-0.88%
|
|
1 week before Fed meeting (11 Sep)
|
11 Sep to 29 Nov
|
+0.53%
|
-3.98%
|
-2.98%
|
|
Right before Fed meeting (17 Sep)
|
17 Sep to 29 Nov
|
+0.54%
|
-4.03%
|
-3.09%
|
|
Source: Bloomberg Finance L.P.,
iFAST compilations. Data as of 29 Nov 2024.
|
2. Positive on investment grade bonds. Pocket high-quality bonds at appealing yields
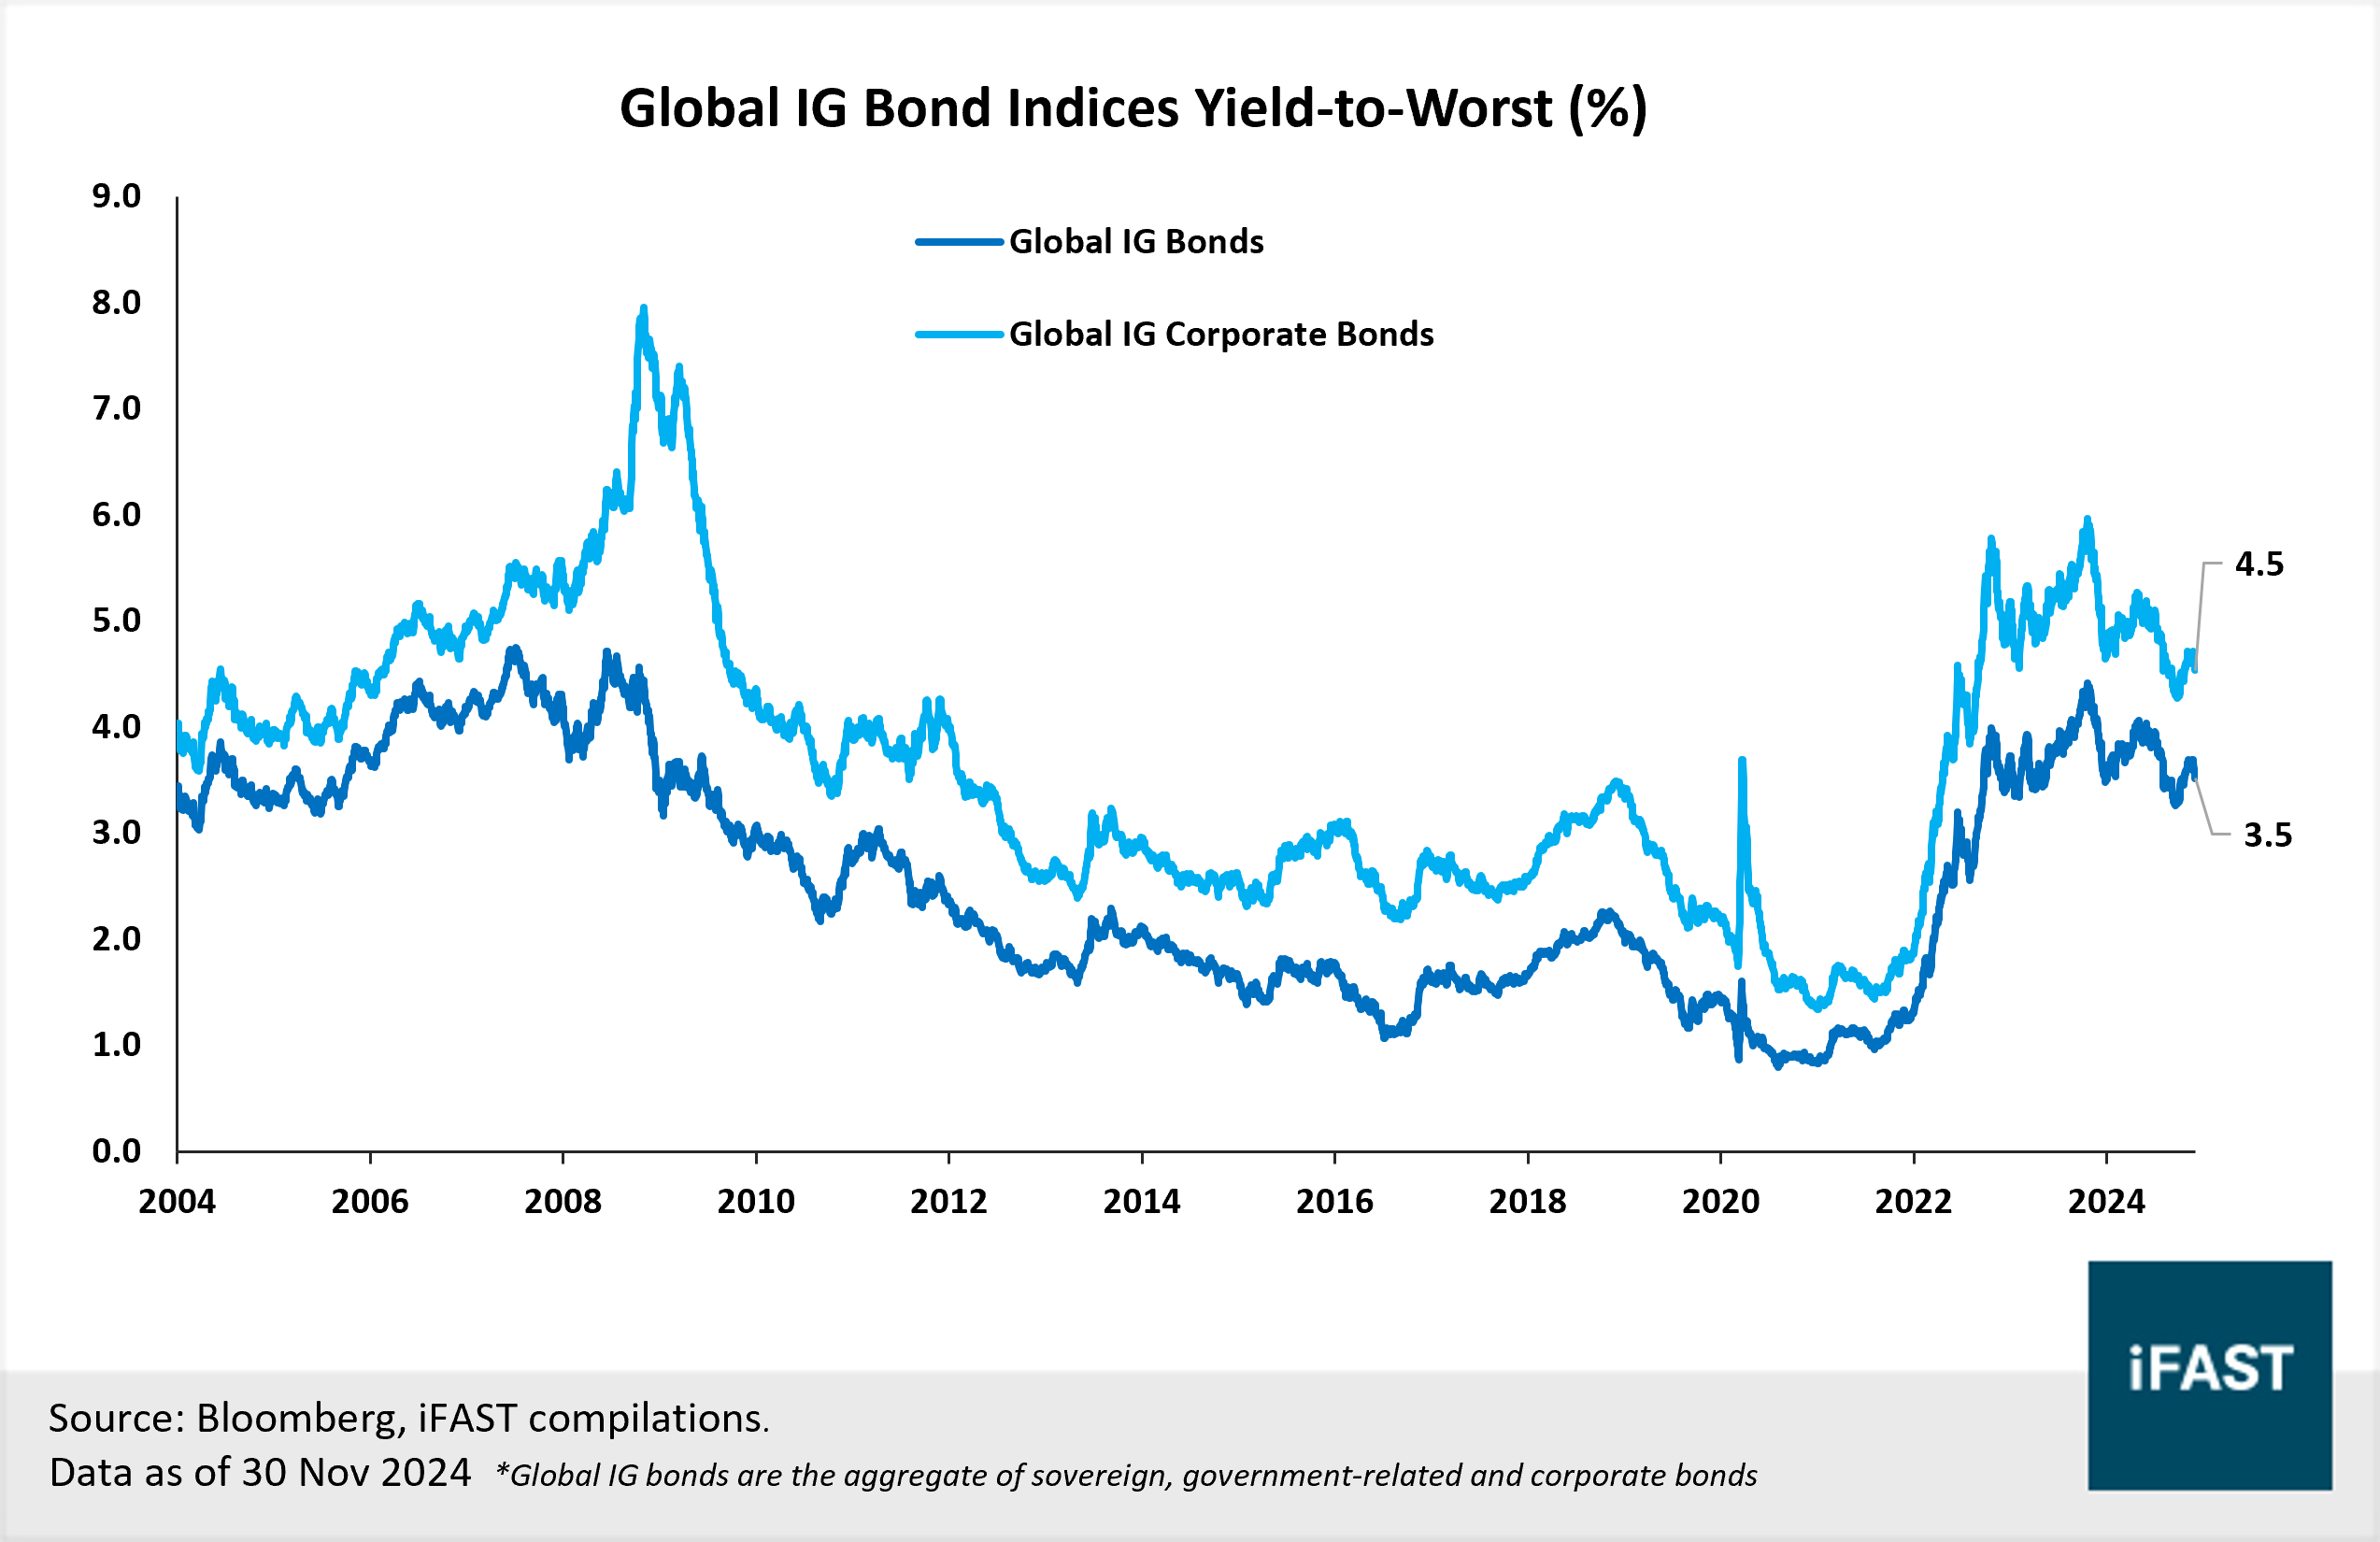
Despite rate cuts across major central banks, yields for investment grade (“IG”) bonds remain attractive as compared to the past decade. Global IG corporate bonds are offering a yield of around 4.5% (on an index level), as compared to the 15-year average of 3.2% (Chart 4). The safer, global IG bonds (aggregate of sovereign, government-related and corporate bonds) are offering a yield of 3.5% (on an index level), as compared to the 15-year average of 2.1%. Yields offered by both segments of IG bonds remain close to their historical peaks, slightly below the 90th percentile range over the past 15 years.
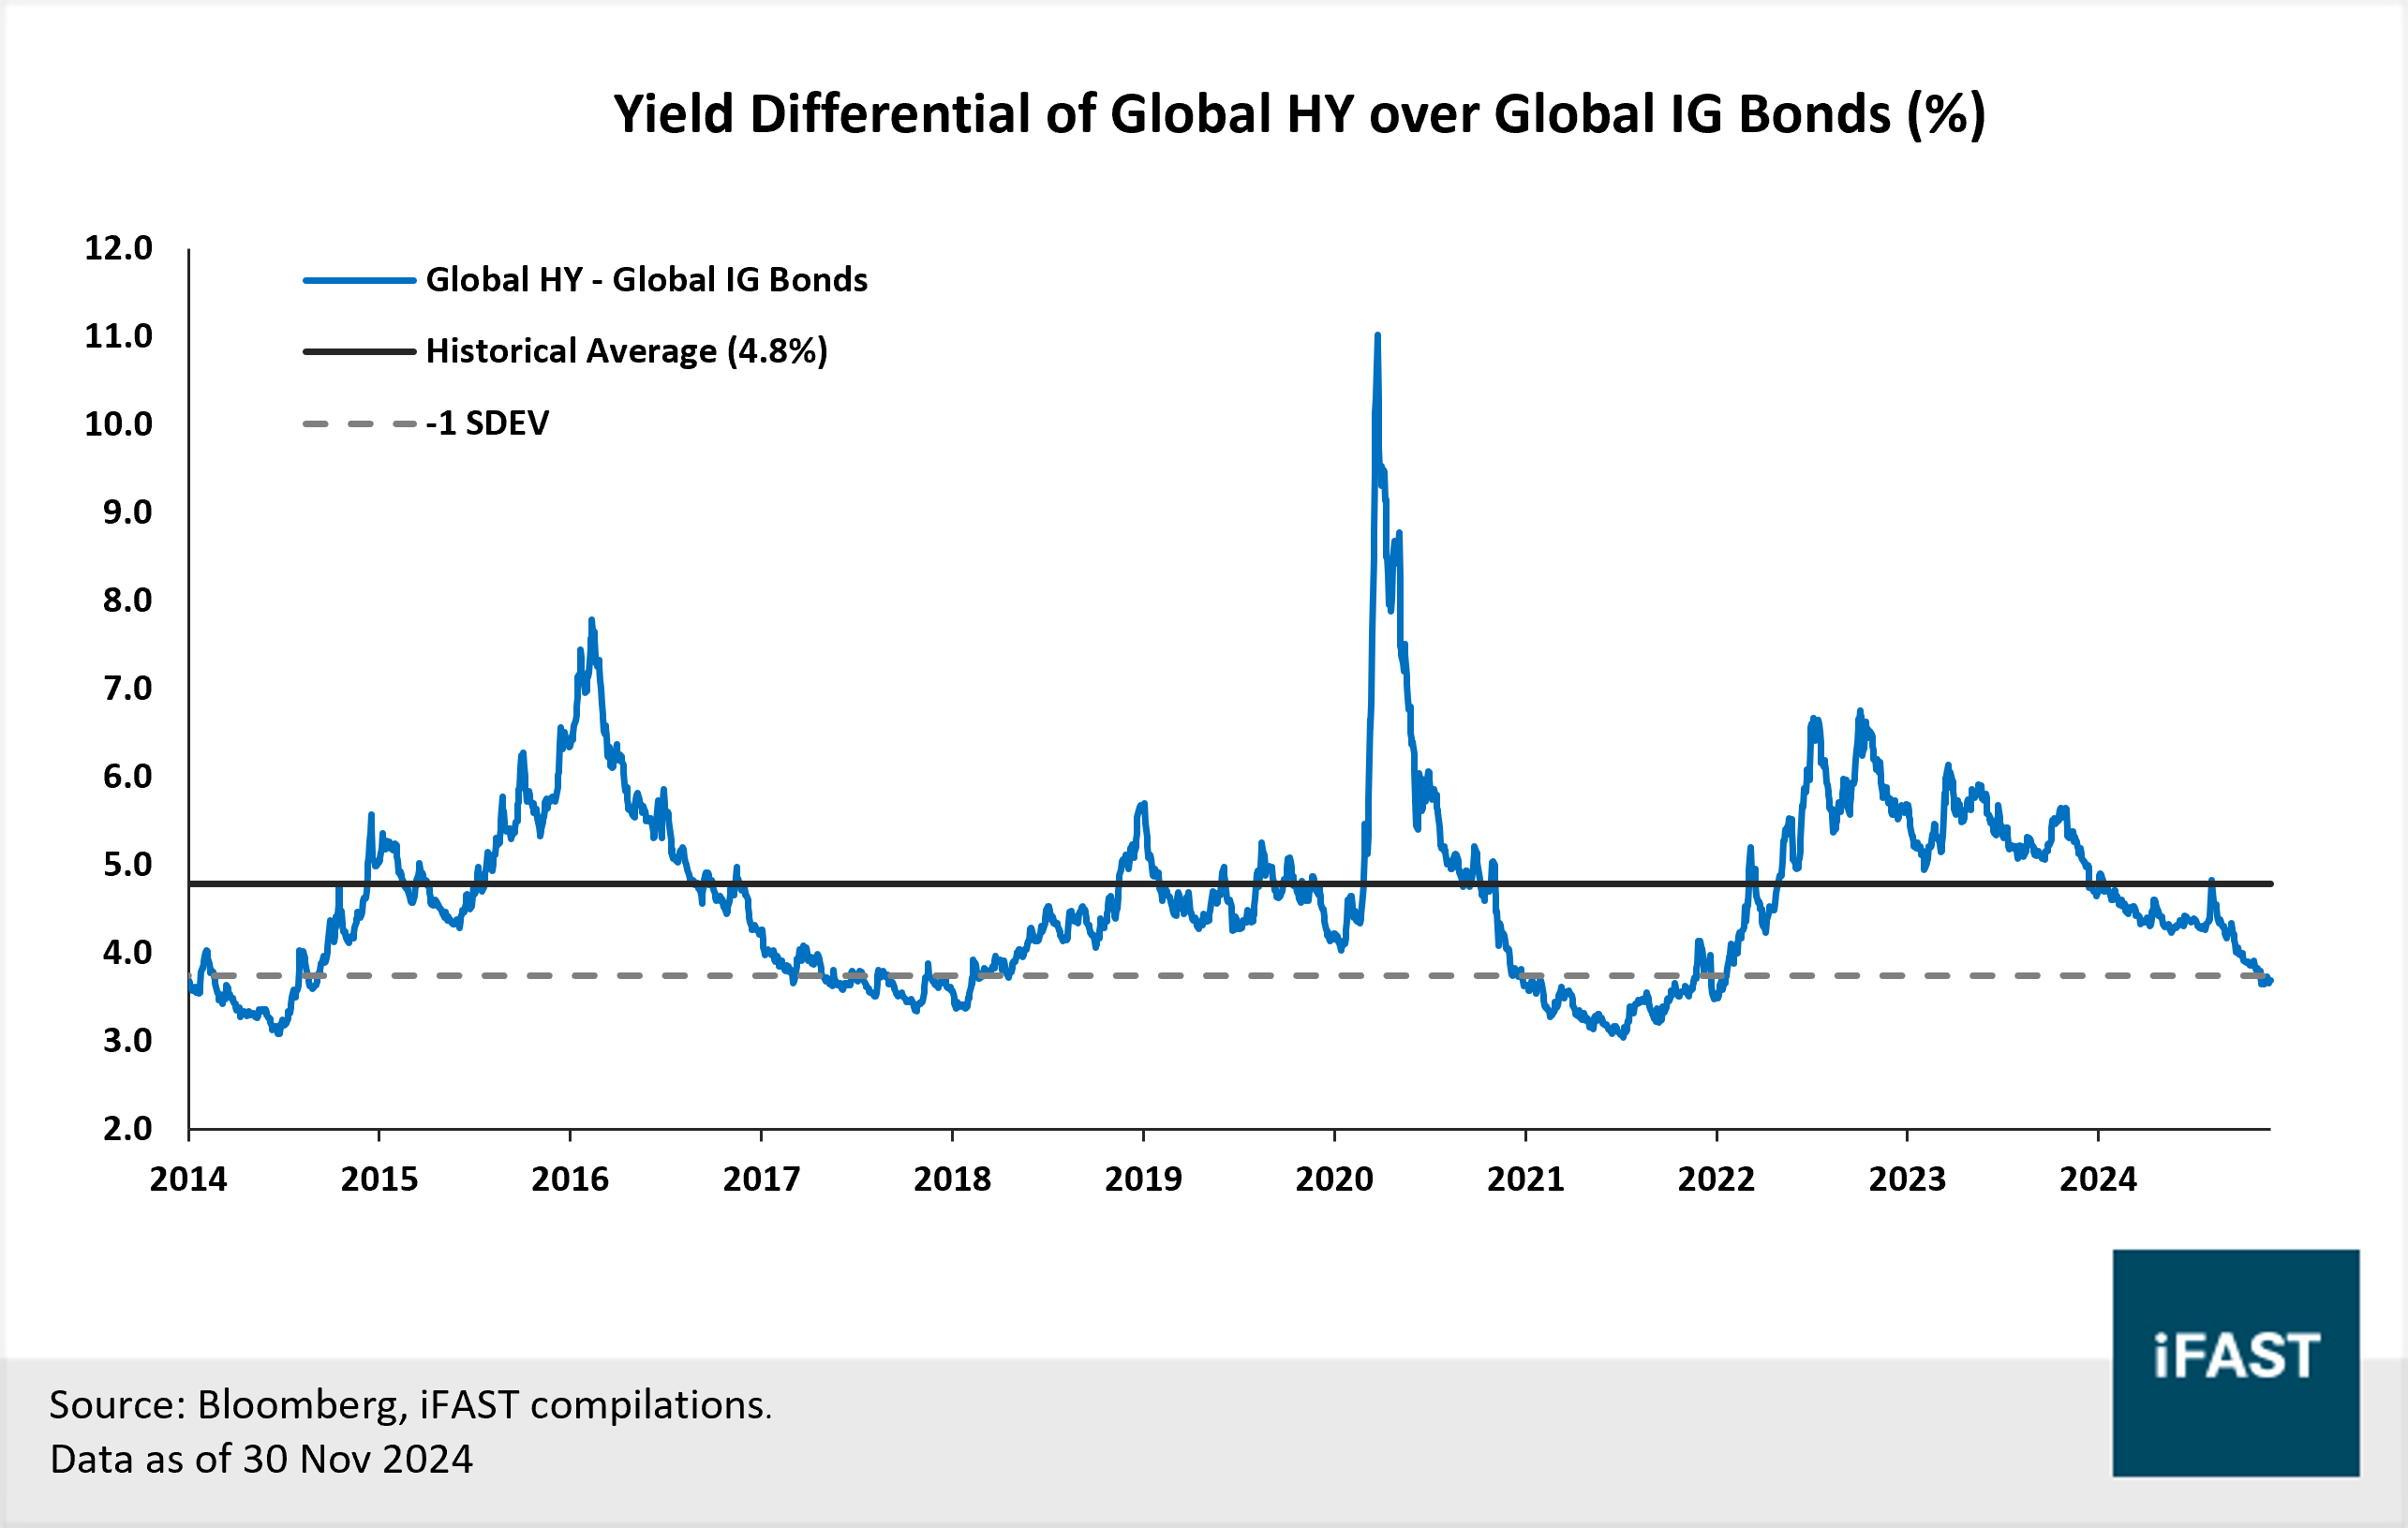
High-quality bonds often trade at lower yields due to narrower credit spreads, assuming bonds of the same tenor and currency. However, with today’s yield backdrop, investors can pocket high-quality bonds at appealing yields. At the same time, there is now significantly lesser extra income by scaling down the quality ladder to invest in riskier bonds. Currently, the yield pickup (376 bps) for global HY bonds over IG bonds is close to historical lows and compares unfavourably to the 15-year average of 480bps (Chart 5).
Credit fundamentals for IG issuers have largely remained healthy and are expected to remain so, even if high benchmark rates persist. Resilient fundamentals and the overall, high-quality nature of IG bonds should provide shelter from potential market and political volatility in 2025. From a valuation standpoint, option-adjusted spreads (“OAS”) for the Global IG bond index continue to hold in historically rich territory like most bond segments, trading around 1.1 standard deviations below its 15-year average. That said, barring a global economic deterioration (which is unlikely in our base case), we do not think there are many potential factors pressuring spreads to widen significantly.
We prefer the more diversified, global IG bonds over Asian IG bonds as valuations for the latter are much tighter, with an OAS of around 2.0 standard deviation below its 15-year average. We are neutral on Asian IG bonds as higher yields are offset by tight valuations. Our primary recommendation is the
Manulife Asia Pacific Investment Grade Bond A MDis SGD, while we also recommend the
Schroder ISF Asian Local Currency Bond A Acc SGD-H for investors specifically looking for a local-currency exposure to Asia IG bonds.
Chart 4: Global IG bond yields remains elevated, with corporate bonds offering around 4.5% on aggregate.
Chart 5: The extra income in exchange for quality has greatly declined. Yield pickup for HY bonds over IG bonds is close to the historical low.
Table 2: Selected investment grade offerings across USD and SGD bond space.
3. Stay selective for high-yield bonds. Hidden gems across the Asian HY bond space.
Amidst the challenging macro backdrop, fundamentals for HY issuers have improved across the year and have reinforced our confidence within this space. HY issuers have demonstrated resiliency to the high cost of debt environment as aggregate interest coverage ratios for issuers have maintained at a healthy level.
Based on our observation, most HY issuers are still able to access the primary market despite higher benchmark rates, which signals low refinancing risk. We believe funding costs for HY issuers are also slowly easing. The average coupon for USD and EUR HY bonds issued in 2024 has declined to 7.7% (USD) and 6.4% (EUR) respectively, from 8.7% (USD) and 7.5% (EUR) in the year prior (Table 2). Lastly, we are also not concerned about the USD HY maturity wall, which is still around five years away, and the EUR HY maturity wall, which is much lower in maturity value (chart 6).
Looking ahead, we think a resilient global growth backdrop and further monetary easing can continue to support fundamentals for HY issuers and expect a low risk of a large-scale increase in defaults. Global HY bonds offer a yield of around 7.3% (on an index level) which is at the 62nd percentile over the past 15 years. We think yields are still attractive at an absolute level, particularly when spreads are near historical lows.
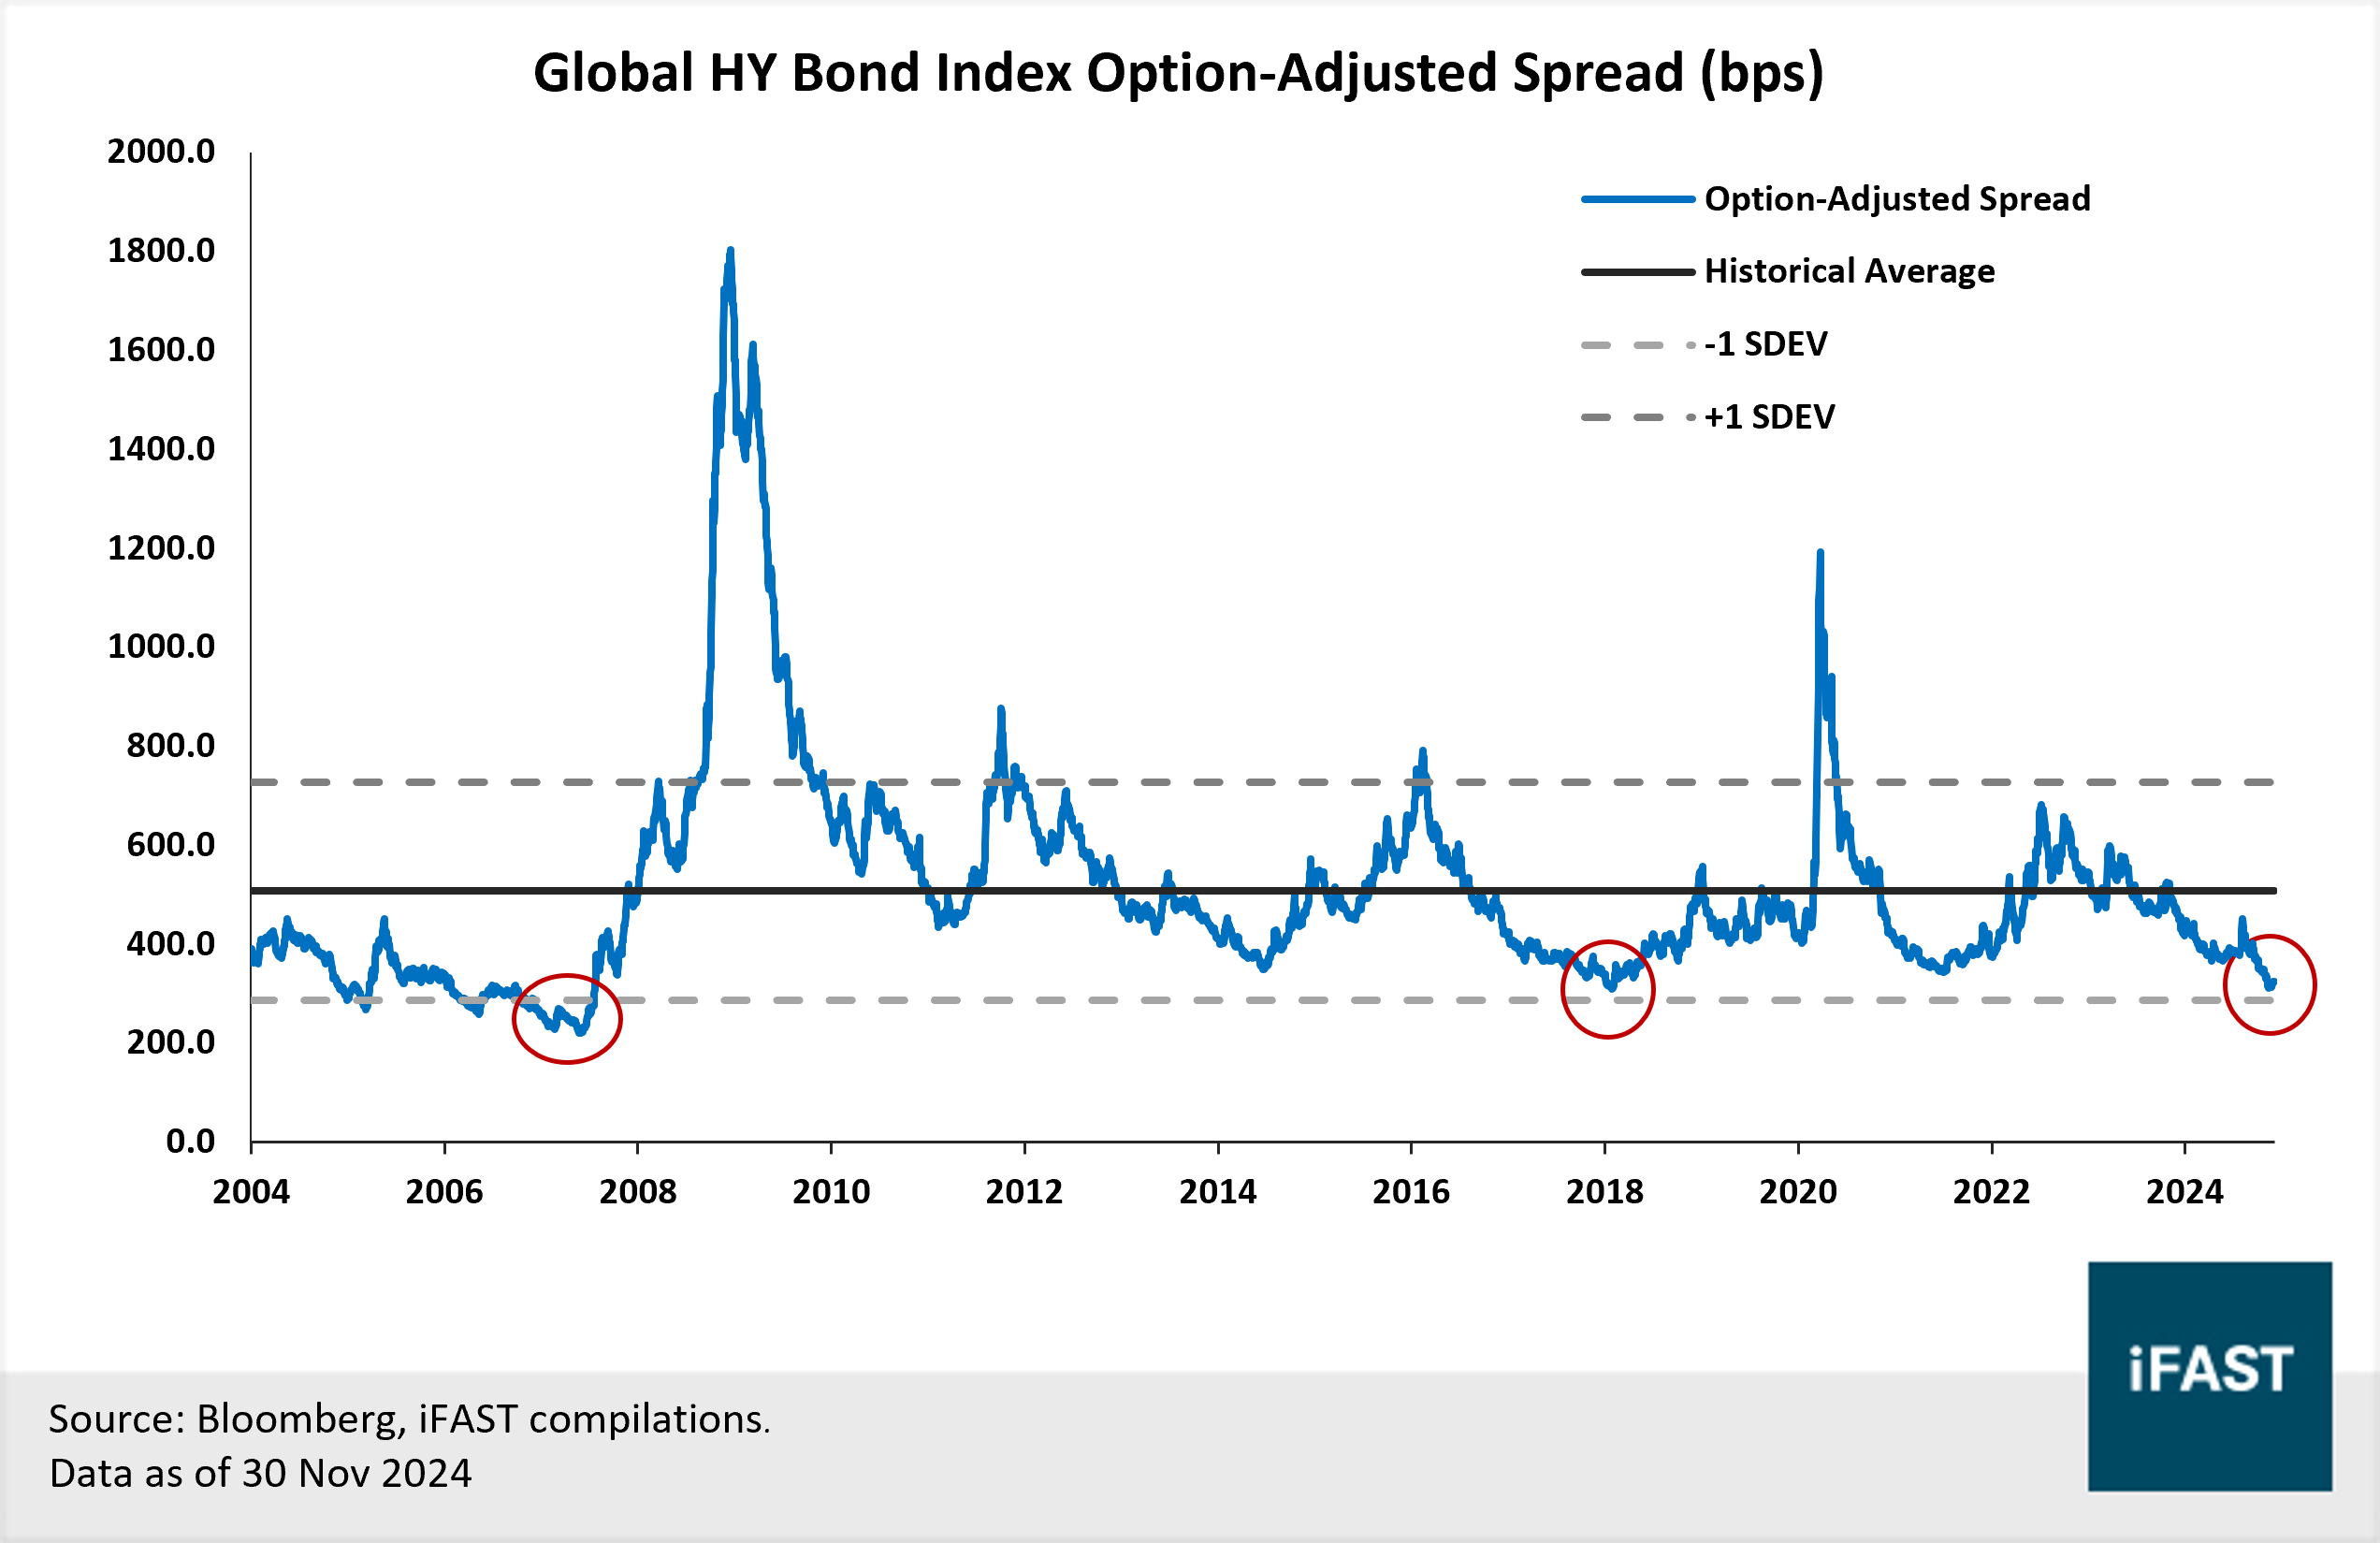
On the flip side, valuations for global HY bonds are tight – even tighter than its IG counterpart. Supported by the robust demand for yield and a resilient macro backdrop, OAS for the global HY bond index has compressed significantly and is trading around -1.2 standard deviation below its 15-year average. We think spreads are suggesting a low implied default rate, which is closely priced to perfection in our view and may reflect the decent macro backdrop highlighted above. Therefore, we see limited room for spreads to contract further, especially with spreads (currently around pre-Covid) approaching pre-GFC levels (Chart 7).
On a geographical level, we believe the investment case for Asian HY bonds has improved. We are no longer as negative and see opportunities across specific sub-sectors. On a broad level, Asian HY bonds offer an attractive yield of 9.3% (on an index level), one of the highest within major bond segments. Meanwhile, the proportion of property developers – the “problem child” - within the Asian HY bond space – has also decreased, replaced with larger exposure to Macau and Indian companies. We see opportunities in four sub-sectors within the Asian HY bond space, including (1) Japanese High Yield, (2) Australian High Yield, (3) Hong Kong developers and (4) Chinese Issuers with international background.
For investors, we recommend an active approach towards the Asian HY bond space. Our recommended fund,
Blackrock Asian High Yield Bond A8 SGD-H, is positioned against risks within the China Real Estate sector. Meanwhile, its remaining positions are towards developers with relatively low near-term redemption pressures, strong access to funding, and small off-balance-sheet obligations.
Related article:
Table 3: The average coupon for USD and EUR HY bonds issued in 2024 has declined, suggesting lower funding costs.
|
Credit Rating
|
Average Coupon p.a. (%)
|
|
USD
|
EUR
|
|
Issued in 2023
|
Issued in 2024
|
Issued in 2023
|
Issued in 2024
|
|
BBB
|
7.0
|
6.1
|
6.0
|
4.7
|
|
BB
|
8.0
|
7.1
|
6.9
|
5.6
|
|
B
|
9.3
|
8.3
|
8.7
|
7.1
|
|
CCC
|
10.1
|
8.6
|
9.8
|
7.9
|
|
Average of all
|
8.6
|
7.7
|
7.5
|
6.4
|
|
Sources: Bloomberg,
iFAST Compilations.
Data as of 30
November 2024.
|
Chart 6: USD HY maturity wall is still five years away while the upcoming EUR HY maturity wall is much sooner
Chart 7: Credit spreads for global HY bonds have compressed significantly and are around pre-COVID levels, approaching the pre-GFC range.
Table 4: Selected higher-yielding offerings across USD and SGD bond space.
4. Staying neutral on emerging market debt
On the positive side, fundamentals across EM debt have improved, with more upgrades than downgrades in 2024. Based on a report from Fitch, this was the most positive year for net upgrades since 2011 for EM sovereign credits. On a macro level, with most major central banks cutting rates in the recent period, interest rate differentials between EM and major developed markets, especially the US, have eased slightly. This has reduced the downward pressure on EM currencies, alleviating some headwinds across EM debt.
On the flip side, valuations across EM debt are tight, trading at around 1.7- 1.8 standard deviations below its 15-year average, leaving little room to compress. Geopolitical events have also impacted the EM debt universe, putting a dent in investor sentiment which has limited fund flows and regional performance throughout 2024. Heading into 2025, we think geopolitical tensions are unlikely to subside, especially with uncertainties from the Trump administration’s policies and a string of local EM elections.
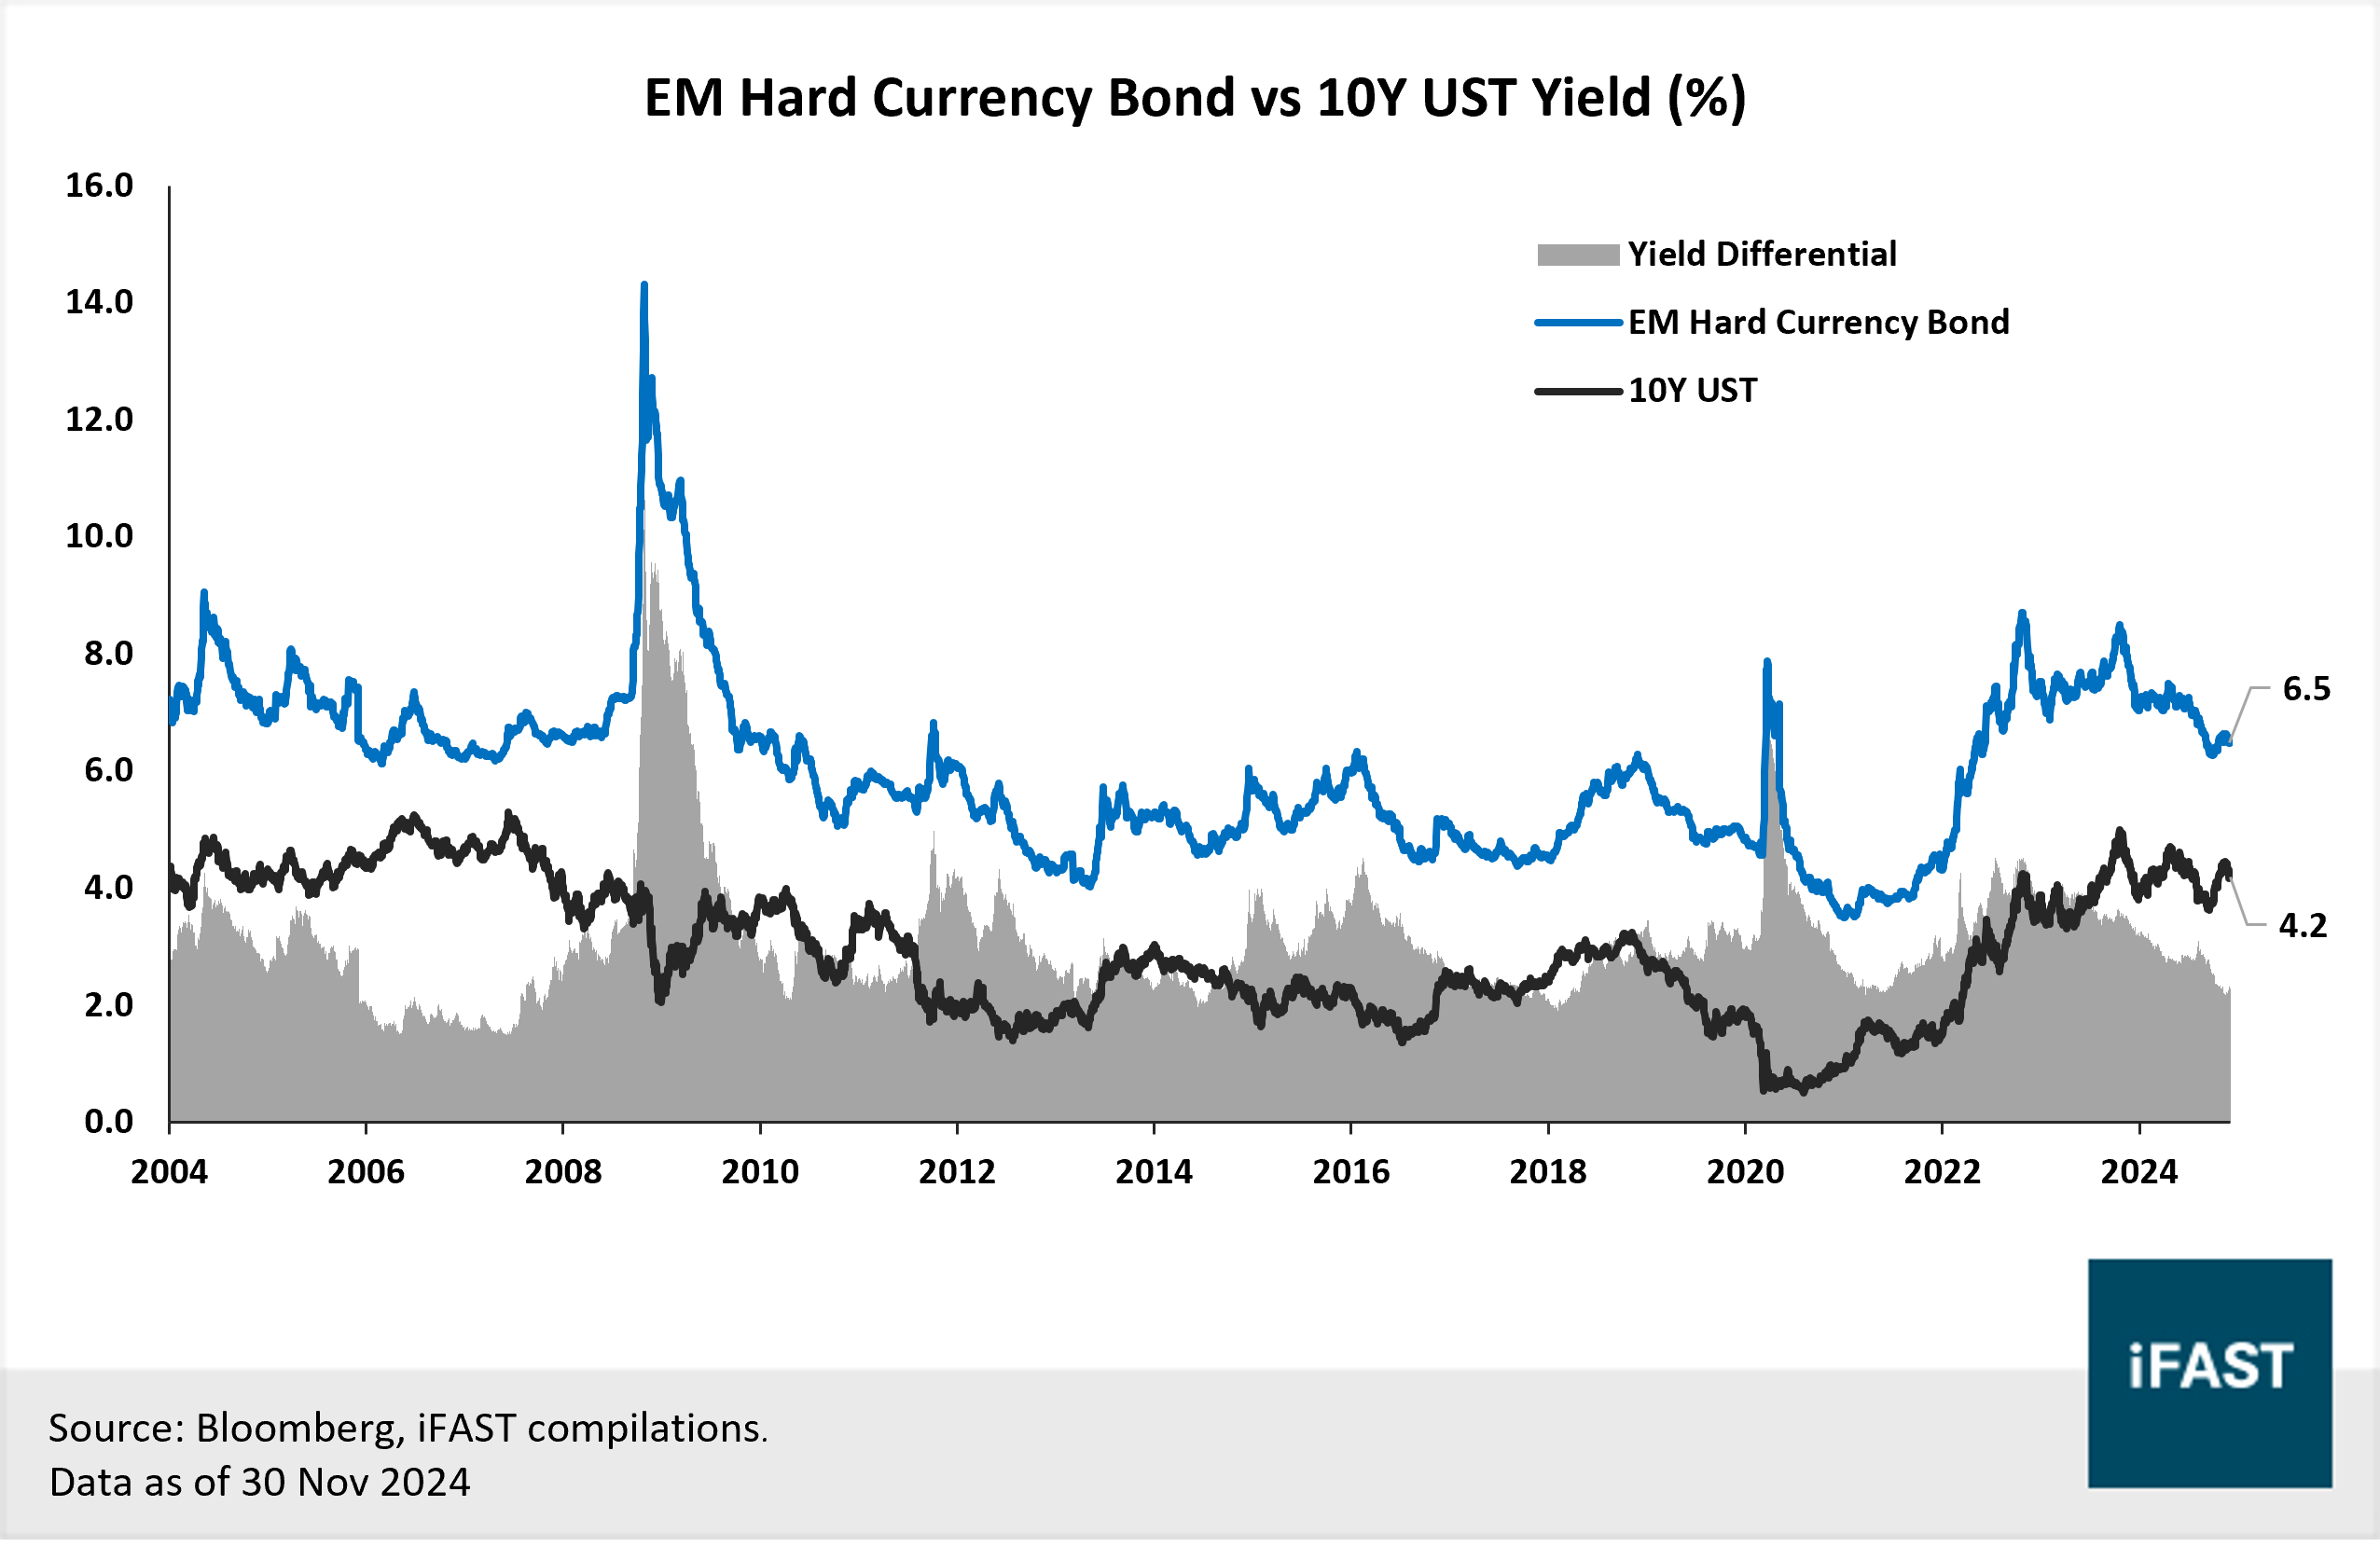
With positive factors and trends in 2024 offset by various negative ones, we maintain a neutral stance for Emerging Market (“EM”) debt, though we see select opportunities within the market. Amongst the EM debt universe, we like EM hard currency bonds as they continue to offer appealing all-in yields of 6.5%, higher than its local currency counterpart. As yields hover above their 15-year average yield (5.50%), and at the 81st percentile in the same period, we think current levels are attractive relative to history and provide decent pickup over the 10-year UST (Chart 8). That said, external debt ratios across major EMs remain elevated. According to Bloomberg, external debt ratios have surpassed their respective 5-year average levels for 12 of the 19 major EM countries, with the total value of external debt reaching a record USD 1.83 trillion.
For investors seeking exposure to EM hard currency bonds, we believe active management can help deliver strong returns in this complex space. We recommend the
PIMCO Emerging Markets Bond Fund Cl E Acc SGD-H. The fund offers a fairly high estimated yield to maturity of 7.82% (as of 30 September) and has consistently fared well against peer funds.
Chart 8: EM hard currency bonds continue to offer high all-in yields, with decent pickup over the 10Y US treasury.
5. Positive on short-term US/ Singapore treasury bills and medium-term Malaysian treasury notes
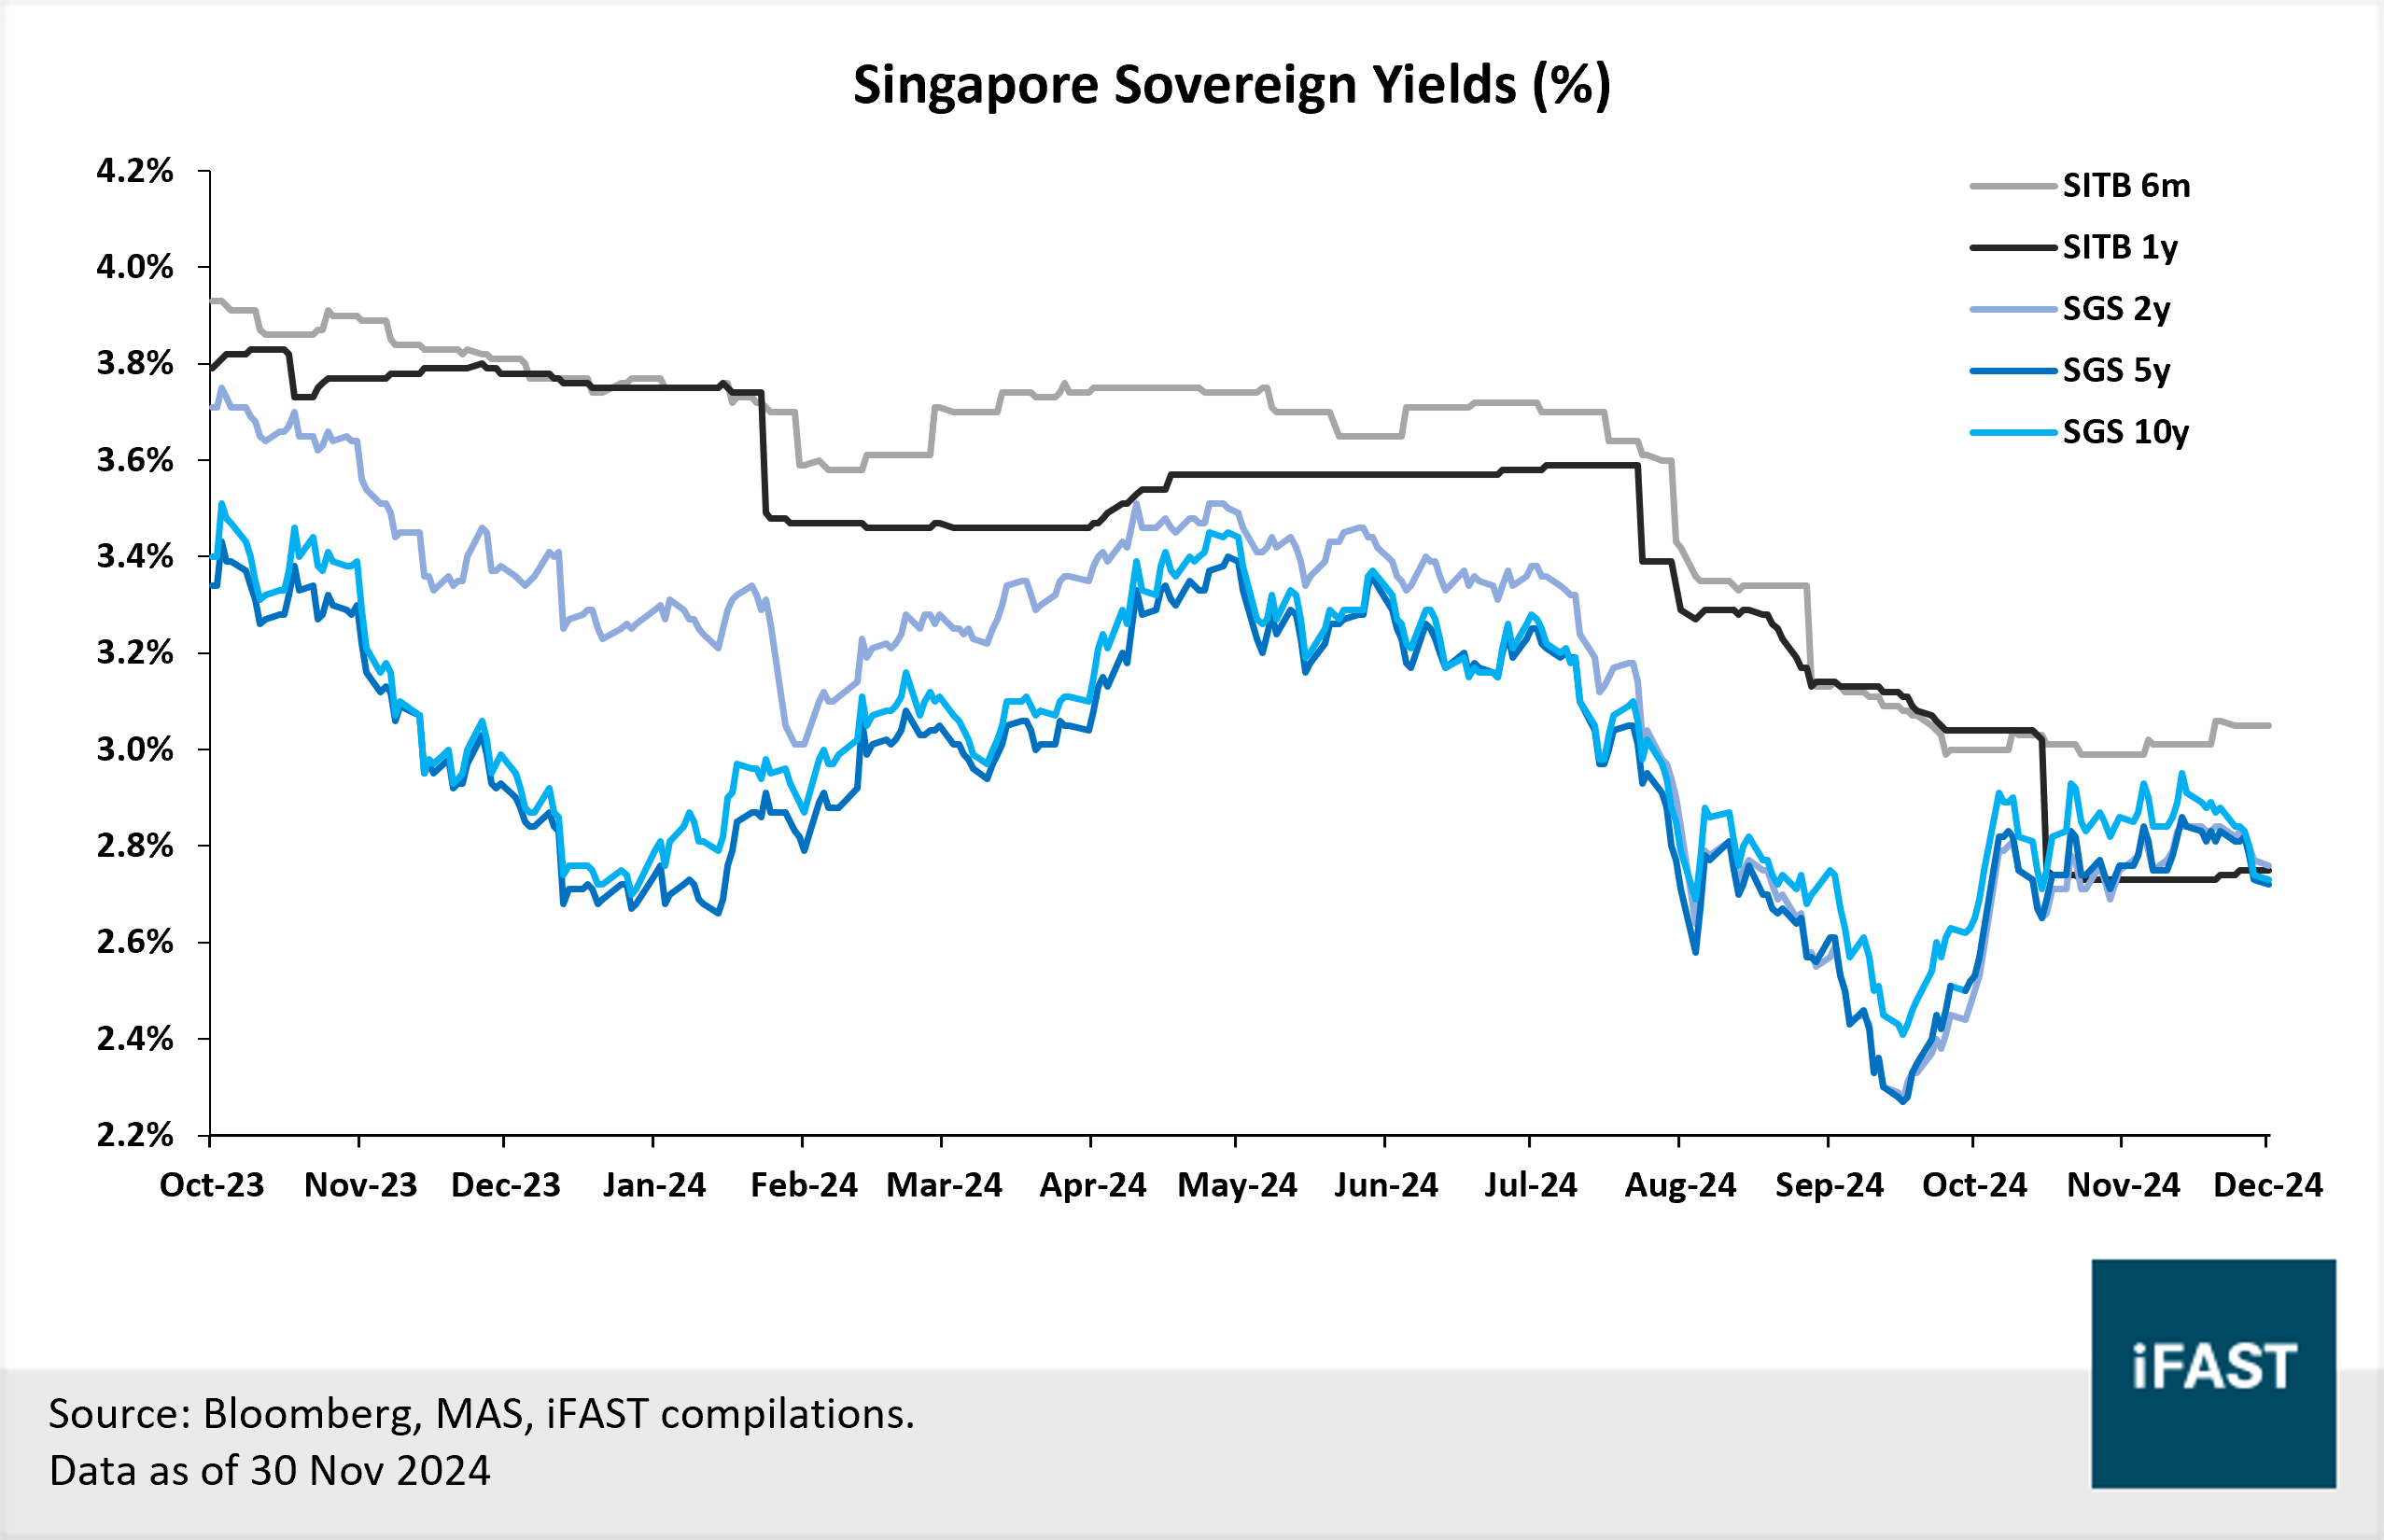
For US and Singapore (“SG”) government securities, we like shorter-term treasury bills as they offer the best value to investors. Both sovereign curves remain largely inverted with short-dated treasuries yielding higher than longer-dated ones (chart 9). For US sovereign bonds, we like 6-month T-bills due to their higher yields and recommend a strategy of rolling over the 6-month T-bills (until the yield curve normalises) can allow investors to enjoy high yields while taking on lower duration risk.
For SG sovereign bonds, we also like the 6-month T-bills as tenors shorter than 6 months (i.e. the MAS bills) are generally unavailable to retail investors. We believe MAS S$NEER policy stance is unlikely to shift in the near term, given the emphasis on geopolitical factors as an upside risk to inflation. Therefore, besides some downward pressure from Fed rate cuts, short-term SG sovereign yields should remain stable, with minimal overall volatility from the SGS yield curve.
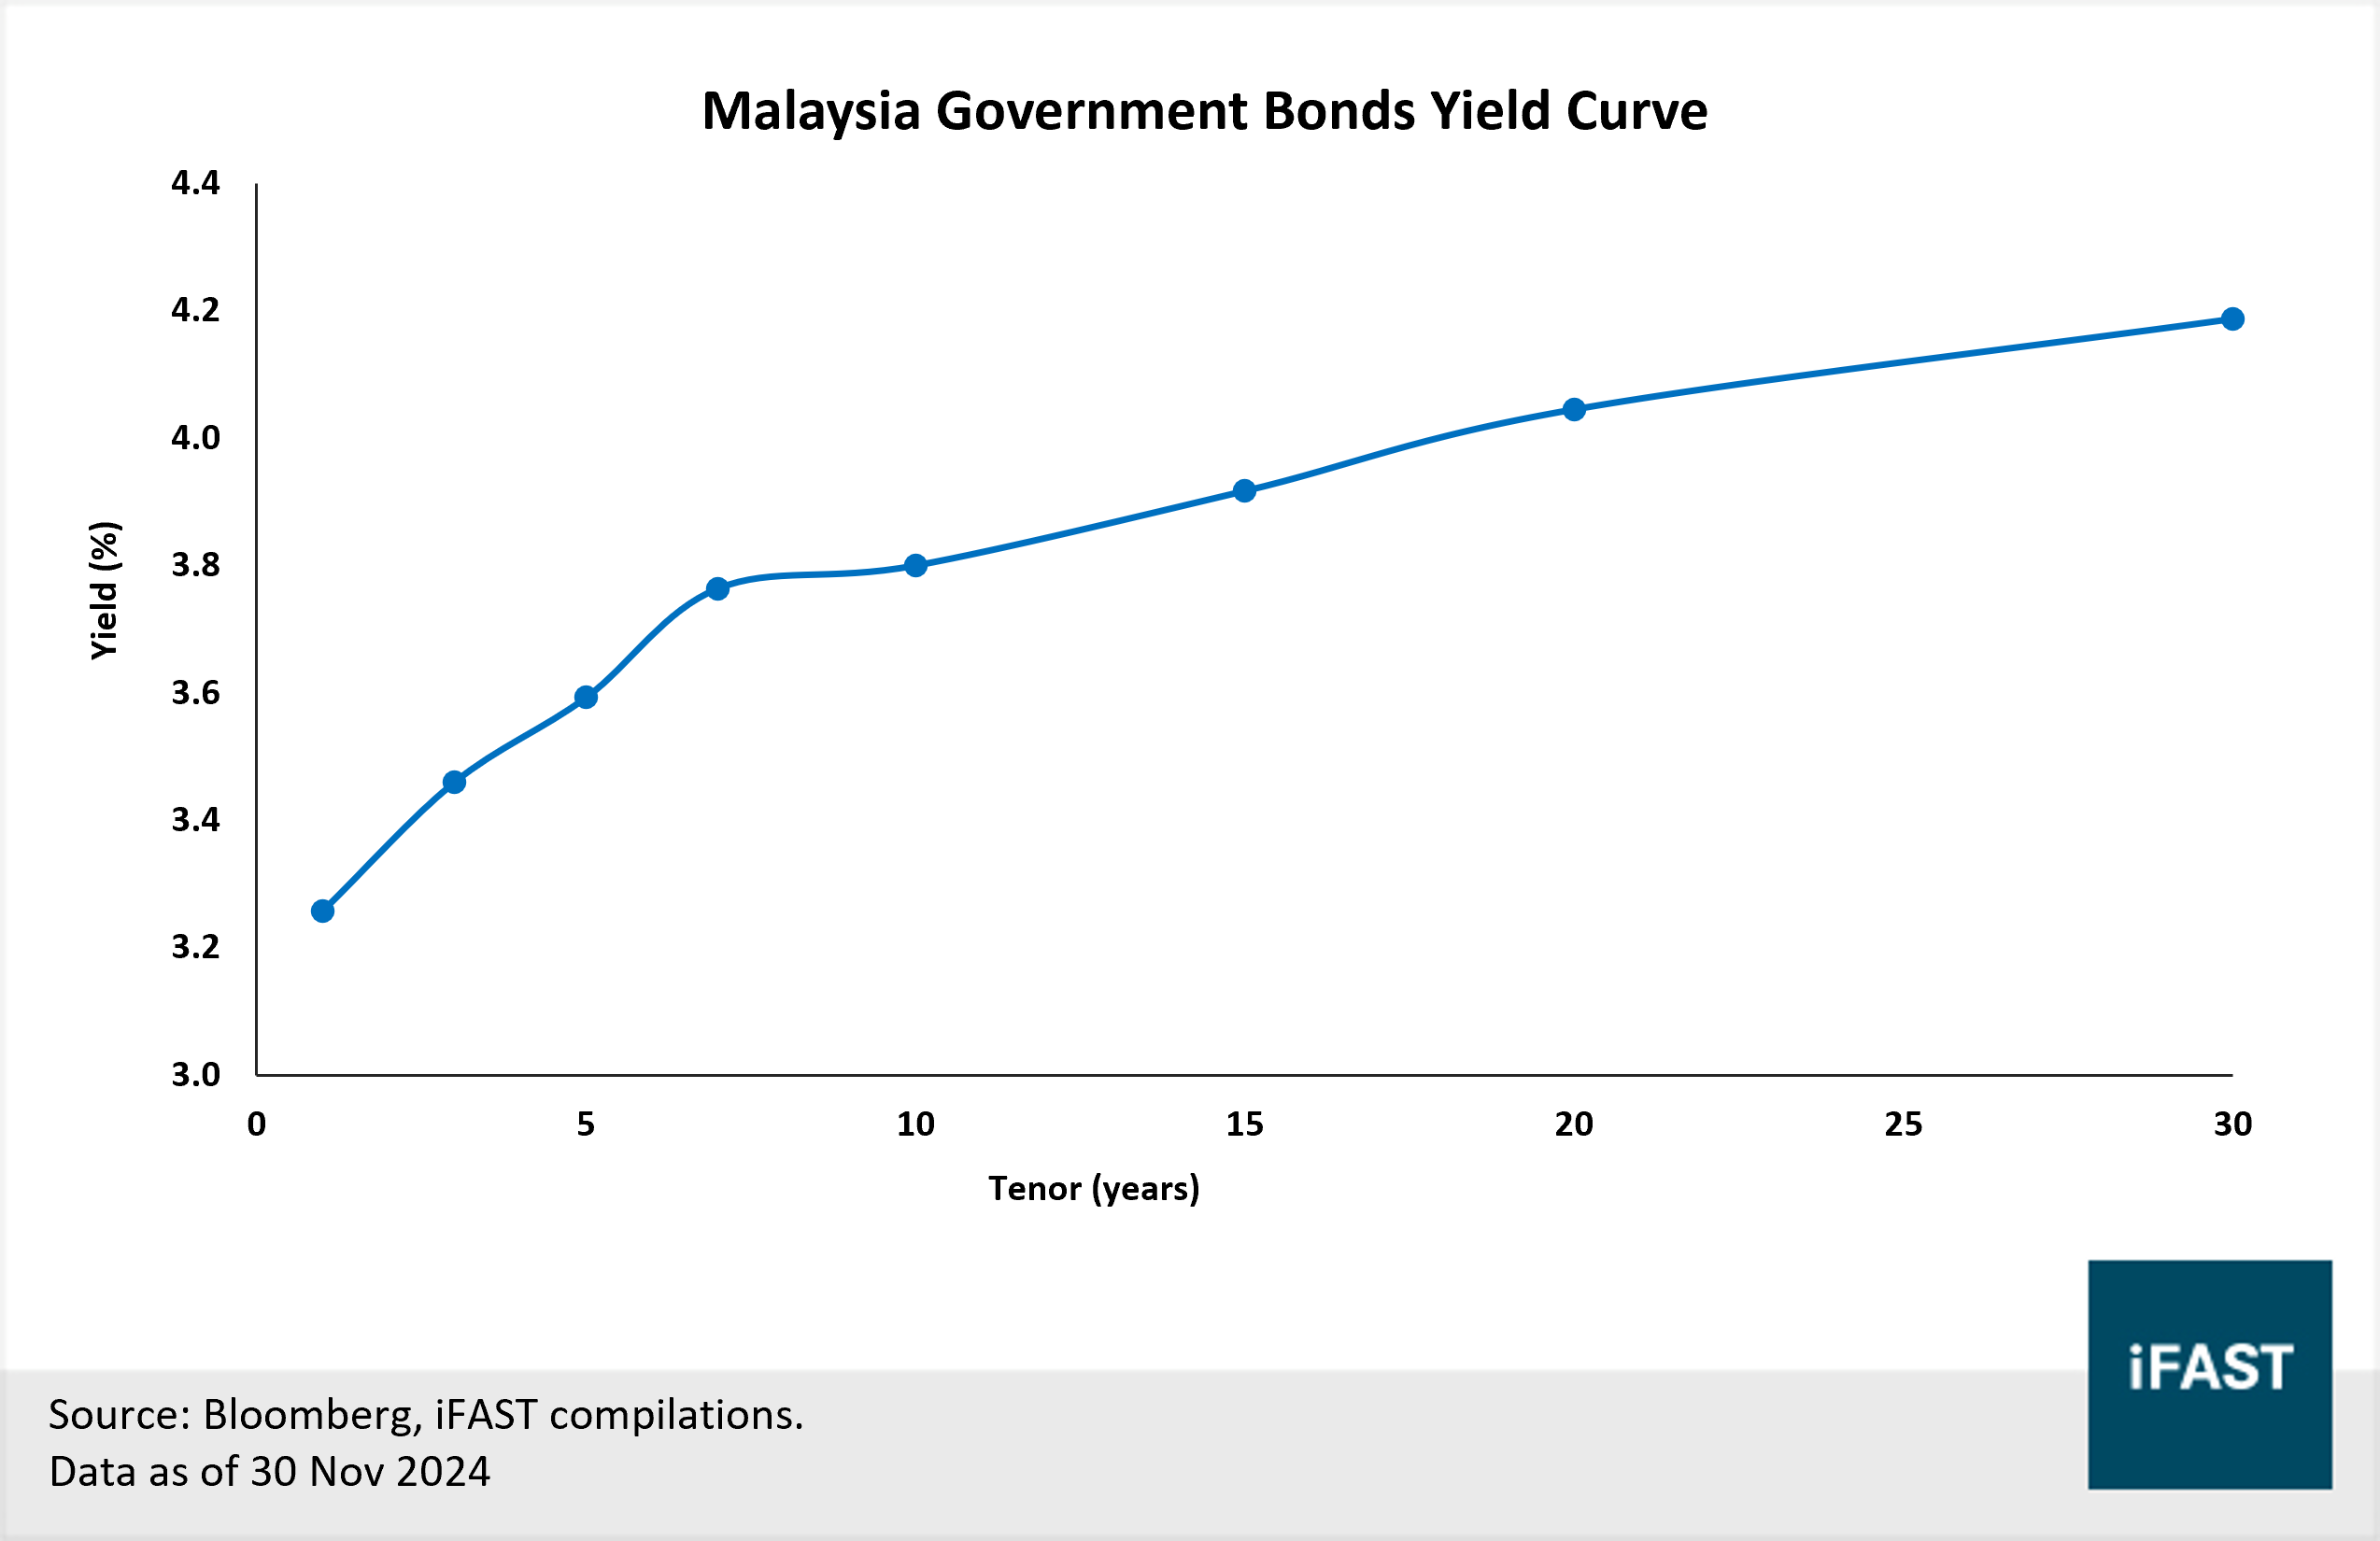
For Malaysian government securities, we like mid to longer duration treasury notes (5 to 7 years). Malaysia’s yield curve remains upward-sloping where yields of longer-term treasuries are generally higher than shorter-term ones (Chart 10). We think treasury notes from the belly of the curve, specifically with maturities between 5 to 7 years, offer the most value.
Chart 9: The 6-month Singapore T-Bills (“SITB”) continue to offer higher yields than other sovereign bonds of longer tenor.
Chart 10: The Malaysian government bond yield curve remains upwards-sloping
Table 3: Summary of recommended fixed income funds
Declaration:
For specific disclosure, at the time of publication of this report, IFPL (via its connected and associated entities) hold a position in MEITUA 2.125% 28Oct2025 Corp (USD), STANLN 4.300% 19Feb2027 Corp (USD), HYUELE 6.250% 17Jan2026 Corp (USD), HSBC 4.375% 23Nov2026 Corp (USD), CMZB 6.500% 24Apr2034 Corp (SGD), BNP 4.750% 15Feb2034 Corp (SGD), TMGSP 4.650% 29Oct2029 Corp (SGD), OLAMSP 4.000% 24Feb2026 Corp (SGD), RAKUTN 11.250% 15Feb2027 Corp (USD), ASLAU 7.500% 26Apr2029 Corp (USD) and the analyst who produced this report hold a NIL position in the abovementioned securities.


' fill='%23fff' stroke='%23707070' d='M0 0h21.6v21.6H0z'/%3e%3c/clipPath%3e%3cclipPath id='c'%3e%3cpath data-name='Rectangle 6531' transform='translate(-6319 -2048)' fill='%23fff' stroke='%23707070' d='M0 0h43.2v21.6H0z'/%3e%3c/clipPath%3e%3cclipPath id='a'%3e%3cpath d='M0 0h21.6v21.6H0z'/%3e%3c/clipPath%3e%3c/defs%3e%3cg data-name='Malaysia -Square' clip-path='url(%23a)'%3e%3cpath fill='%23fff' d='M0 0h21.6v21.6H0z'/%3e%3cg data-name='Mask Group 325' transform='translate(6348 2048)' clip-path='url(%23b)'%3e%3cg data-name='Mask Group 324' transform='translate(-35)' clip-path='url(%23c)'%3e%3cg data-name='Group 21195'%3e%3cpath data-name='Path 14718' d='M-6319-2048h43.2v21.6h-43.2z' fill='%23fff'/%3e%3cpath data-name='Path 14719' d='M-6317.457-2047.229h41.657m0 3.086h-41.657m0 3.086h41.657m0 3.086h-41.657' fill='none' stroke='%23c00' stroke-width='1.543'/%3e%3cpath data-name='Path 14720' d='M-6319-2048h21.6v13.114h-21.6z' fill='%23006'/%3e%3cpath data-name='Path 14721' d='M-6319-2034.886h43.2m0 3.086h-43.2m0 3.086h43.2' fill='none' stroke='%23c00' stroke-width='1.543'/%3e%3c/g%3e%3cpath data-name='Path 14722' d='M-6302.5-2045.686l.344 2.353 1.331-1.967-.714 2.269 2.054-1.2-1.626 1.731 2.372-.19-2.218.858 2.218.858-2.372-.19 1.626 1.736-2.054-1.2.714 2.269-1.331-1.97-.344 2.358-.344-2.353-1.331 1.97.714-2.269-2.054 1.2 1.626-1.737-2.372.19 2.218-.858-2.218-.859 2.372.19-1.626-1.736 2.054 1.2-.714-2.267 1.331 1.97zm-1.929.1a4.114 4.114 0 100 7.521 4.629 4.629 0 110-7.521z' fill='%23fc0'/%3e%3c/g%3e%3c/g%3e%3c/g%3e%3c/svg%3e "malaysiaIcon")
'%3e%3cpath fill='%23fff' d='M0 0h21.6v21.6H0z'/%3e%3cg data-name='067-hong-kong'%3e%3cpath data-name='Rectangle 6488' fill='%23d80027' d='M0 0h22v22H0z'/%3e%3cg data-name='Group 21086' fill='%23f0f0f0'%3e%3cpath data-name='Path 14432' d='M11.911 8.264c-.248 1.032-.689.835-.905 1.735a2.373 2.373 0 011.109-4.614c-.429 1.803.018 1.956-.204 2.879z'/%3e%3cpath data-name='Path 14433' d='M8.606 9.029c.9.555.581.913 1.37 1.4a2.373 2.373 0 01-4.045-2.481c1.577.964 1.866.586 2.675 1.081z'/%3e%3cpath data-name='Path 14434' d='M8.311 12.409c.807-.689 1.048-.271 1.752-.871a2.373 2.373 0 11-3.609 3.081c1.408-1.202 1.136-1.594 1.857-2.21z'/%3e%3cpath data-name='Path 14435' d='M11.435 13.734c-.406-.98.066-1.08-.287-1.935a2.373 2.373 0 111.815 4.385c-.708-1.71-1.165-1.573-1.528-2.45z'/%3e%3cpath data-name='Path 14436' d='M13.66 11.173c-1.058.083-1.007-.4-1.929-.325a2.373 2.373 0 114.731-.371c-1.846.145-1.856.621-2.802.696z'/%3e%3c/g%3e%3c/g%3e%3c/g%3e%3c/svg%3e "hongKongIcon")





' d='M0 0h300v57H0z'/%3e%3c/svg%3e "sgFsmLogoEnIcon")


'%3e%3cpath fill='%23fff' d='M0 0h21.6v21.6H0z'/%3e%3cg data-name='141-singapore'%3e%3cpath data-name='Rectangle 6502' fill='%23f0f0f0' d='M0 0h22v22H0z'/%3e%3cpath data-name='Rectangle 6503' fill='%23d80027' d='M0 0h22v10H0z'/%3e%3cg data-name='Group 21092' fill='%23f0f0f0'%3e%3cpath data-name='Path 14455' d='M2.917 5.365A3.128 3.128 0 015.374 2.31a3.128 3.128 0 100 6.11 3.128 3.128 0 01-2.457-3.055z'/%3e%3cpath data-name='Path 14456' d='M6.939 2.46l.222.683h.718l-.581.422.222.683-.581-.422-.581.422.222-.683-.581-.422h.718z'/%3e%3cpath data-name='Path 14457' d='M5.193 3.801l.222.683h.718l-.581.422.222.683-.581-.422-.581.422.222-.683-.581-.422h.718z'/%3e%3cpath data-name='Path 14458' d='M8.68 3.801l.222.683h.718l-.581.422.222.683-.581-.422-.581.422.222-.683-.581-.422h.718z'/%3e%3cpath data-name='Path 14459' d='M8.01 5.811l.222.683h.718l-.581.422.222.683-.581-.422-.581.422.222-.683-.581-.422h.718z'/%3e%3cpath data-name='Path 14460' d='M5.863 5.811l.222.683h.718l-.581.422.222.683-.581-.422-.581.422.222-.683-.581-.422h.718z'/%3e%3c/g%3e%3c/g%3e%3c/g%3e%3c/svg%3e "singaporeIcon")


' d='M0 0h67v14H0z'/%3e%3c/svg%3e "msFooterLogoIcon")
