


' fill='%23fff' stroke='%23707070' d='M0 0h21.6v21.6H0z'/%3e%3c/clipPath%3e%3cclipPath id='c'%3e%3cpath data-name='Rectangle 6531' transform='translate(-6319 -2048)' fill='%23fff' stroke='%23707070' d='M0 0h43.2v21.6H0z'/%3e%3c/clipPath%3e%3cclipPath id='a'%3e%3cpath d='M0 0h21.6v21.6H0z'/%3e%3c/clipPath%3e%3c/defs%3e%3cg data-name='Malaysia -Square' clip-path='url(%23a)'%3e%3cpath fill='%23fff' d='M0 0h21.6v21.6H0z'/%3e%3cg data-name='Mask Group 325' transform='translate(6348 2048)' clip-path='url(%23b)'%3e%3cg data-name='Mask Group 324' transform='translate(-35)' clip-path='url(%23c)'%3e%3cg data-name='Group 21195'%3e%3cpath data-name='Path 14718' d='M-6319-2048h43.2v21.6h-43.2z' fill='%23fff'/%3e%3cpath data-name='Path 14719' d='M-6317.457-2047.229h41.657m0 3.086h-41.657m0 3.086h41.657m0 3.086h-41.657' fill='none' stroke='%23c00' stroke-width='1.543'/%3e%3cpath data-name='Path 14720' d='M-6319-2048h21.6v13.114h-21.6z' fill='%23006'/%3e%3cpath data-name='Path 14721' d='M-6319-2034.886h43.2m0 3.086h-43.2m0 3.086h43.2' fill='none' stroke='%23c00' stroke-width='1.543'/%3e%3c/g%3e%3cpath data-name='Path 14722' d='M-6302.5-2045.686l.344 2.353 1.331-1.967-.714 2.269 2.054-1.2-1.626 1.731 2.372-.19-2.218.858 2.218.858-2.372-.19 1.626 1.736-2.054-1.2.714 2.269-1.331-1.97-.344 2.358-.344-2.353-1.331 1.97.714-2.269-2.054 1.2 1.626-1.737-2.372.19 2.218-.858-2.218-.859 2.372.19-1.626-1.736 2.054 1.2-.714-2.267 1.331 1.97zm-1.929.1a4.114 4.114 0 100 7.521 4.629 4.629 0 110-7.521z' fill='%23fc0'/%3e%3c/g%3e%3c/g%3e%3c/g%3e%3c/svg%3e "malaysiaIcon")
'%3e%3cpath fill='%23fff' d='M0 0h21.6v21.6H0z'/%3e%3cg data-name='067-hong-kong'%3e%3cpath data-name='Rectangle 6488' fill='%23d80027' d='M0 0h22v22H0z'/%3e%3cg data-name='Group 21086' fill='%23f0f0f0'%3e%3cpath data-name='Path 14432' d='M11.911 8.264c-.248 1.032-.689.835-.905 1.735a2.373 2.373 0 011.109-4.614c-.429 1.803.018 1.956-.204 2.879z'/%3e%3cpath data-name='Path 14433' d='M8.606 9.029c.9.555.581.913 1.37 1.4a2.373 2.373 0 01-4.045-2.481c1.577.964 1.866.586 2.675 1.081z'/%3e%3cpath data-name='Path 14434' d='M8.311 12.409c.807-.689 1.048-.271 1.752-.871a2.373 2.373 0 11-3.609 3.081c1.408-1.202 1.136-1.594 1.857-2.21z'/%3e%3cpath data-name='Path 14435' d='M11.435 13.734c-.406-.98.066-1.08-.287-1.935a2.373 2.373 0 111.815 4.385c-.708-1.71-1.165-1.573-1.528-2.45z'/%3e%3cpath data-name='Path 14436' d='M13.66 11.173c-1.058.083-1.007-.4-1.929-.325a2.373 2.373 0 114.731-.371c-1.846.145-1.856.621-2.802.696z'/%3e%3c/g%3e%3c/g%3e%3c/g%3e%3c/svg%3e "hongKongIcon")


1. The US economy and stock market will maintain its dominance over the world.
2. Downside risks to global economy have increased, but the US will do well.
3. Digital economy will continue to thrive in the long-term, supported by the AI boom.
4. Semiconductors: An indispensable part of modern tech and a key beneficiary of AI adoption.
5. Japan remains an attractive structural opportunity, supported by a positive earnings outlook.
6. Consider Japan small-caps as tactical idea to complement large-cap exposure.
7. China could potentially be this year’s dark horse if the government demonstrates its commitment to protecting the private sector.
8. Fixed income: Stick to short-duration, investment grade bonds. Be selective in the high yield space.
9. Consider adding duration when the yield curve normalises.
10. Currency views: Neutral on the USD, positive on the JPY, SGD, and MYR.
1. The US economy and stock market will maintain its dominance over the world.
• Donald Trump was elected with a mandate to “make America great again,” which is strangely fascinating. While the US has its share of challenges, its economy and stock market – at least – do not have to be made great again; they already are.
• In 1990, the US made up about two-fifths of the GDP of the G7 group of advanced economies. Today, it accounts for half. Since the onset of Covid-19, the US economy has outperformed its peers, with its GDP growth more than three times that of the rest of the G7 countries. The US has also successfully held off China’s challenge. A decade ago, many analysts predicted that China would have, by now, overtaken the US as the world’s largest economy. Instead, its economy has lagged in recent years, from about 75% of the US economy in 2021 to 65% today.
• We believe the US has several key strengths that position it well to maintain its global dominance. The US provides fertile ground for investment, with the largest and highest-quality companies today predominantly based there, spanning sectors such as the digital economy and semiconductor industries. It is also home to the world’s largest technology giants, including Alphabet, Amazon, Apple, Meta, Microsoft, and Nvidia.
• These companies are mostly industry leaders with sustainable competitive advantages that will allow them to stay ahead of the competition. They are also well-positioned to benefit significantly from any future technological advancements, including the artificial intelligence (AI) revolution, where Big Tech holds the greatest potential to control every layer of the AI value chain. Most of these companies operate on a global scale, holding dominant positions not only in the US but also in various international markets.
• The US has the world’s largest, deepest, and most liquid capital markets, providing efficient channels for financing businesses. This is a significant advantage that is hard to replicate, as a well-developed capital market is crucial for fostering innovation. It ensures that the US will continue to lead innovation, making it more likely that future tech success stories – ones that could define the rules of any future technological advancements – will emerge from the US, rather than from Europe or China.
Table 1: Projections for the S&P 500 Index
|
S&P 500 Index |
2023 |
2024E |
2025E |
2026E |
|
Earnings Per Share (EPS) |
221.24 |
250.00 |
277.00 |
310.00 |
|
Earnings Growth YoY |
-1.39% |
13.00% |
10.80% |
11.91% |
|
PE Ratio |
21.56 |
24.13 |
21.78 |
19.46 |
|
Upside Potential (based on a fair PE Ratio of 22X) |
- |
- |
- |
13.06% |
|
Source: Bloomberg Finance L.P., iFAST Compilations. Data as of 30 Nov 2024 |
||||
Figure 1: Share price vs. EPS chart for S&P 500 Index
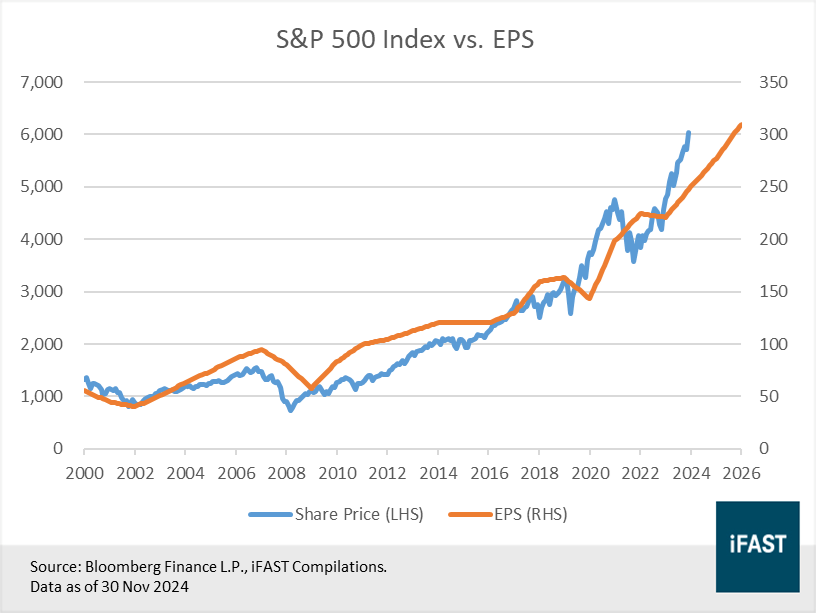
Table 2: Recommended products for the US
|
Recommended Products |
|
|
ETF |
Vanguard S&P 500 ETF (NYSE:VOO) |
|
JPMorgan U.S. Quality Factor ETF (NYSE:JQUA) |
|
|
Unit Trust |
|
2. Downside risks to global economy have increased, but the US will do well.
• While we expect the US to maintain its global dominance, this does not mean we expect a smooth journey ahead. Trump’s re-election has introduced significant uncertainty to the global economic outlook. His recent proposal to impose tariffs on China, Canada and Mexico is likely to harm growth and drive up prices. Other governments may also retaliate, further restricting trade and exacerbating the impact on global growth.
• Before you start panicking, it is important to note that the US is home to a high concentration of high-quality companies with strong profitability and solid balance sheets. This positions them well to absorb potential shocks. The largest US companies are global in scope, selling not only to US consumers but also to global ones. As a result, their earnings growth is driven not just by the US economy but by global growth as well.
• Furthermore, US companies, particularly those in tech, are clear beneficiaries of megatrends like AI adoption. Their earnings are tied more to long-term structural trends than by short-term economic fluctuations, making them resilient to adverse economic conditions.
• The US economy is highly diversified, making it less vulnerable to trade wars compared to other countries. Moreover, few nations are positioned to outperform the US: Europe’s political paralysis and economic weakness are limiting the region’s prospects, while China continues to face challenges in reviving its battered economy.
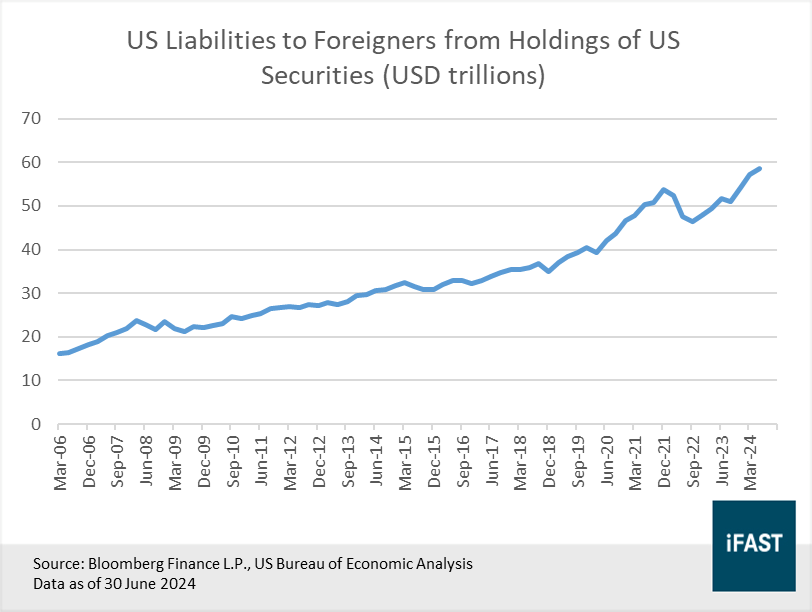
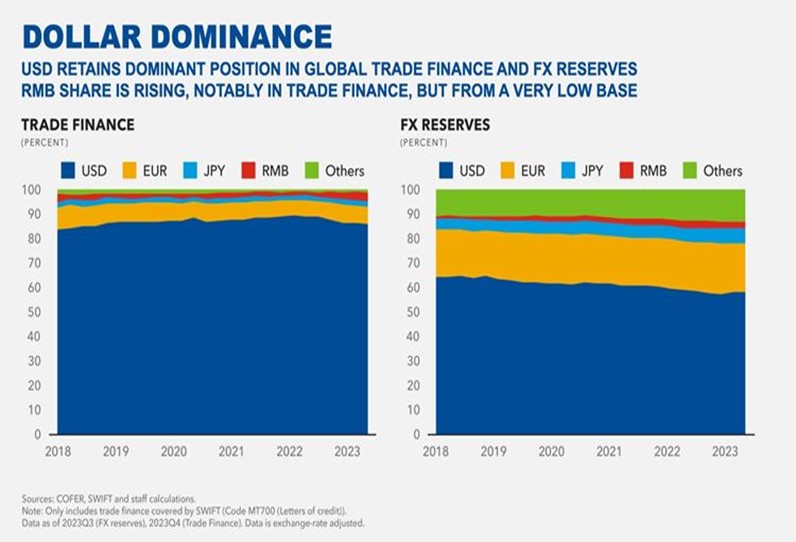
• While a widening fiscal deficit is a valid concern, we believe it is not a near-term danger to the economy given the dominance of the USD in global markets. The USD plays a critical role in global trade, accounting for 54% of foreign trade invoices globally – most of it not directly involving the US. Governments and central banks around the world also hold USD-dominated assets as reserves, with USD assets comprising about 59% of global foreign currency reserves. As the deepest and most liquid market in the world, the US is a key source of assets for global investors, with foreign holdings of US securities rising steadily over the years (Figure 2). The global dominance of the USD ensures consistent demand for the currency, providing a significant buffer against any fiscal crisis and allowing for a higher debt-carrying capacity.
Figure 2: Foreign holdings of US securities have been rising steadily over the years
3. Digital economy will continue to thrive in the long-term, supported by the AI boom.
• In the first half of 2024, gains in the US stock market were primarily driven by the technology sector. Digital economy stocks, measured by the Nasdaq CTA Internet Index rose 14.1%, growing at nearly twice the pace of the S&P 500 Ex-Information Technology & Telecommunication Services Index which gained 7.7%. In the second half of the year, however, the market rally expanded beyond the tech sector, with both indices delivering comparable gains.
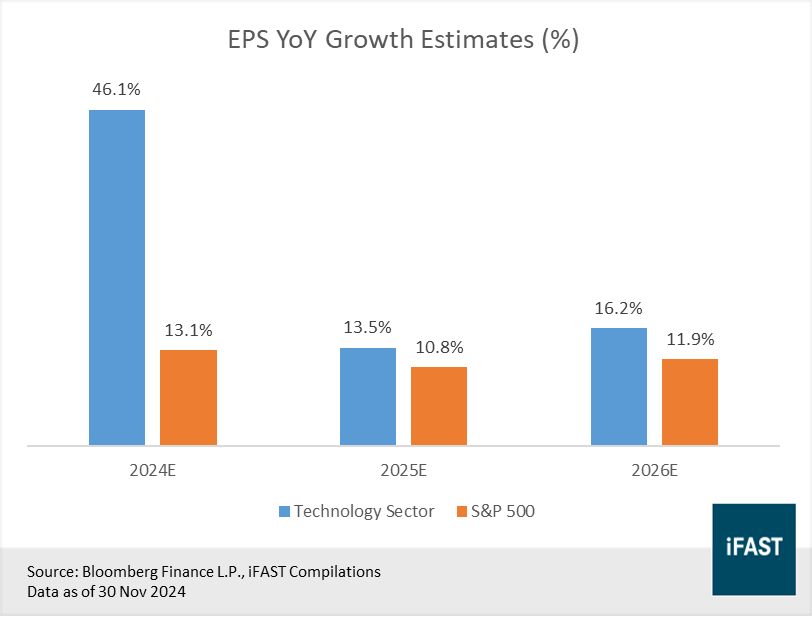
• While we expect this broadening trend to persist due to a resilient US economy and improving earnings growth in non-tech sectors, we anticipate that earnings growth in the tech sector will continue to outpace other sectors (Figure 3). This would in turn drive the outperformance of tech stocks in the long run.
Figure 3: Tech earnings growth is likely to continue outpacing non-tech sectors
• Within the digital economy, we continue to favour the US tech giants for their global business models and strong competitive advantages. These companies operate on a global scale and have consistently been able to grow their revenue by capturing market share in international markets. Key competitive advantages, such as network effects and high switching costs, make their products/services integral to the daily operations of consumers and businesses, enabling them to sustain growth and profitability over time.
• Big Tech companies are also well positioned to reap the benefits of structural megatrends, such as AI. The increasing capital expenditure by Big Tech signals robust demand for AI solutions. As forerunners of AI development, these companies not only develop cutting-edge AI technologies themselves, but also back independent model-makers like OpenAI, Mistral, and Anthropic through funding and partnerships. As such, Big Tech firms are expected to be key beneficiaries of future AI growth.
• Lastly, Big Tech firms have huge cash reserves that allow them to invest significantly in R&D and acquire or invest in promising up-and-coming companies. Their strong credit ratings also allow them to borrow at lower costs compared to smaller firms. With solid balance sheets, these companies are well-positioned to navigate a higher-for-longer interest-rate environment while cementing their market dominance.
Table 3: Projections for Nasdaq CTA Internet Index
|
Nasdaq CTA Internet Index |
2023 |
2024E |
2025E |
2026E |
|
Earnings Per Share (EPS) |
32.10 |
48.25 |
54.74 |
63.60 |
|
Earnings Growth YoY |
66.39% |
50.30% |
13.45% |
16.19% |
|
PE Ratio |
34.90 |
30.65 |
27.02 |
23.26 |
|
Upside Potential (based on a fair PE Ratio of 30X) |
- |
- |
- |
29.00% |
|
Source: Bloomberg Finance L.P., iFAST Compilations. Data as of 30 Nov 2024 |
||||
Figure 4: Share price vs. EPS chart for the Nasdaq CTA Internet Index
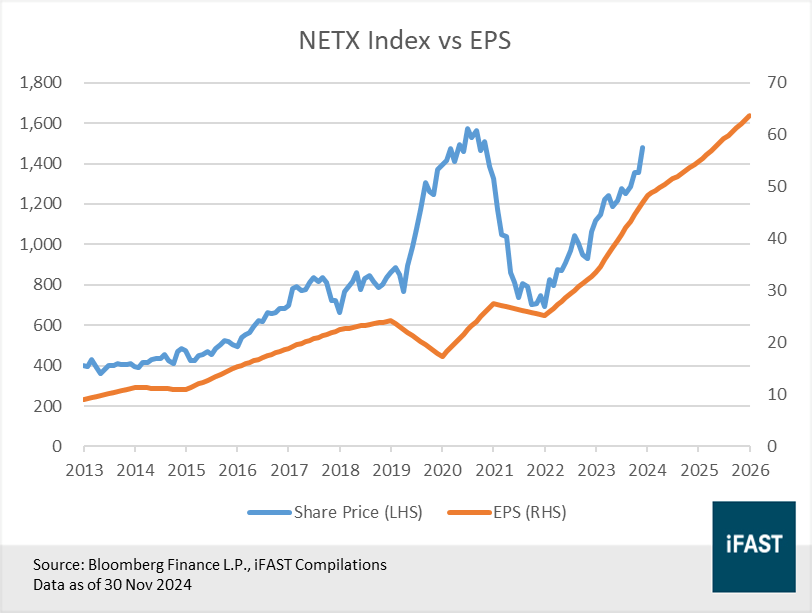
Table 4: Recommended products for the digital economy
|
Recommended Products |
|
|
ETF |
Invesco NASDAQ Internet ETF (NASDAQ: PNQI) |
|
Unit Trust |
|
4. Semiconductors: An indispensable part of modern tech and a key beneficiary of AI adoption.
• Semiconductors are the backbone of modern technology, powering everything from computers and medical devices to data centres, Internet of Things (IoT) devices, and automotives. As the world becomes more digitalised, chipmakers are expected to see a huge structural increase in demand, driven by an increasing number of end-user products incorporating higher silicon content.
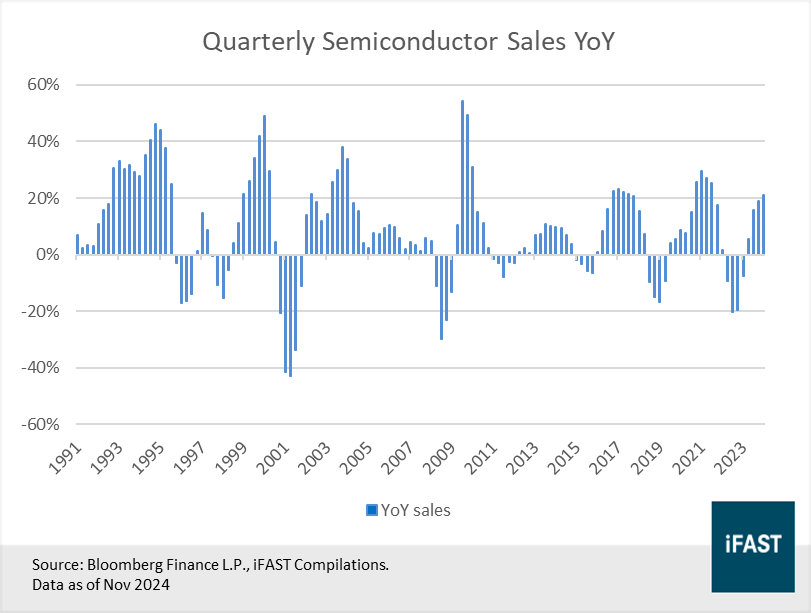
• The semiconductor industry is currently in an upcycle, led by strong demand for AI chips. Quarterly year-over-year semiconductor sales have been positive for the past four quarters, while monthly sales in September rose 23.2% YoY, a 30-month high (Figure 5). We anticipate that AI spending by Big Tech companies will sustain strong chip demand and compensate for the ongoing recovery in the cyclical consumer tech segment.
Figure 5: The semiconductor industry is in the midst of an upcycle
• The high cost of CAPEX and R&D required in the industry makes it difficult for new companies to enter the market, let alone compete with established players. By limiting competition, these high barriers to entry allow existing players to sustain higher profits and market share. ASML, for example, is the sole provider of EUV lithography machines globally, a critical equipment used in chip production.
• Governments around the world are providing subsidies to build up their own semiconductor supply chain amid geopolitical tensions. In the US, the USD 280 billion CHIPS and Science Act was enacted to boost American semiconductor R&D and manufacturing. The onshoring of semiconductor production will help to improve the resiliency of supply chains and ensure that supply can keep up with demand over time.
• As digitalisation continues to fuel chip demand and governments intensify their focus on the industry, we anticipate semiconductors will rank among the best-performing industries in the coming decade. Investors seeking exposure to this sector may consider the VanEck Semiconductor ETF (NASDAQ: SMH).
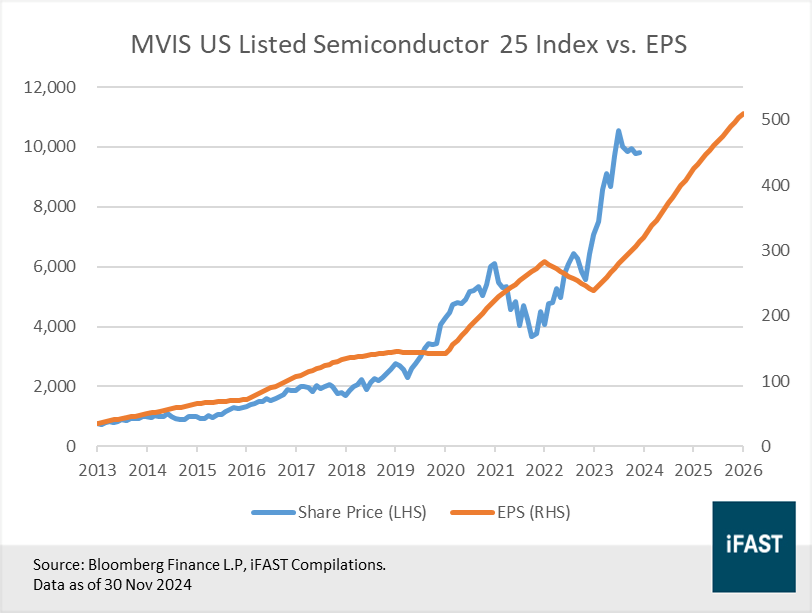
Table 5: Projections for MVIS US Listed Semiconductor 25 Index
|
MVSMHTR Index |
2023 |
2024E |
2025E |
2026E |
|
Earnings Per Share (EPS) |
238.66 |
303.00 |
425.00 |
510.00 |
|
Earnings Growth YoY |
-15.55% |
26.96% |
40.26% |
20.00% |
|
PE Ratio |
29.61 |
33.88 |
24.15 |
20.13 |
|
Upside Potential (based on a fair PE Ratio of 24X) |
- |
- |
- |
19.24% |
|
Source: Bloomberg Finance L.P., iFAST Compilations. Data as of 30 Nov 2024 |
||||
Figure 6: Share price vs. EPS chart for the MVIS US Listed Semiconductor 25 Index
5. Japan remains an attractive structural opportunity, supported by a positive earnings outlook.
• We believe Japan deserves a long-term strategic allocation within investors’ portfolios. Despite political uncertainties, it should not derail the country’s path towards economic normalisation. There is broad consensus among political parties on the necessity for Japan to pursue transformative change and pro-growth policies.
• Japan’s economy is undergoing a period of structural transformation from deflation to inflation. As inflation takes hold, companies are finally addressing the pay issue after decades of lacklustre wage growth. Japan's largest labour union group Rengo announced that it will seek wage hikes of at least 5% in 2025, mirroring this year's hefty increase.
• Continued wage hikes will boost households' purchasing power and keep the economy strong. The improving macro backdrop, coupled with structural reforms aimed at promoting capital efficiency and shareholder returns, is gradually fostering an environment conducive to growth.
• While we expect the JPY to strengthen, corporate earnings remain well-supported by the global competitiveness of Japanese companies and key megatrends like digitalisation. The IT sector, the largest in the Nikkei 225, is positioned to drive earnings growth. We anticipate leading semiconductor firms like Tokyo Electron and Advantest to deliver mid-double-digits earnings growth fuelled by strong global demand for AI-related chips.
• Prime Minister Ishiba has pledged more than USD 65 billion of fresh support for the nation’s semiconductor and AI sector. Japan's push to become a semiconductor leader has led to new listings, including memory chipmaker Kioxia, which plans to debut on the Tokyo Stock Exchange by June 2025. The Japanese government, in partnership with major corporations has also established Rapidus, a homegrown chipmaker focused on producing advanced chips. This will further boost the IT sector’s influence within the Nikkei.
Table 6: Projections for Nikkei 225 Index
|
Nikkei 225 Index |
FY2023 |
FY2024 |
FY2025 |
FY2026 |
|
Earnings Per Share (EPS) |
1,289 |
1,813 |
2,135 |
2,400 |
|
Earnings Growth YoY |
-25.7% |
41.2% |
17.8% |
12.4% |
|
PE Ratio |
26.0 |
21.1 |
17.9 |
15.9 |
|
Upside Potential (based on a fair PE Ratio of 20X) |
- |
- |
- |
25.6% |
|
Source: Bloomberg Finance L.P., iFAST Compilations. Data as of 30 Nov 2024 |
||||
Figure 7: Share price vs. EPS chart for the Nikkei 225 Index
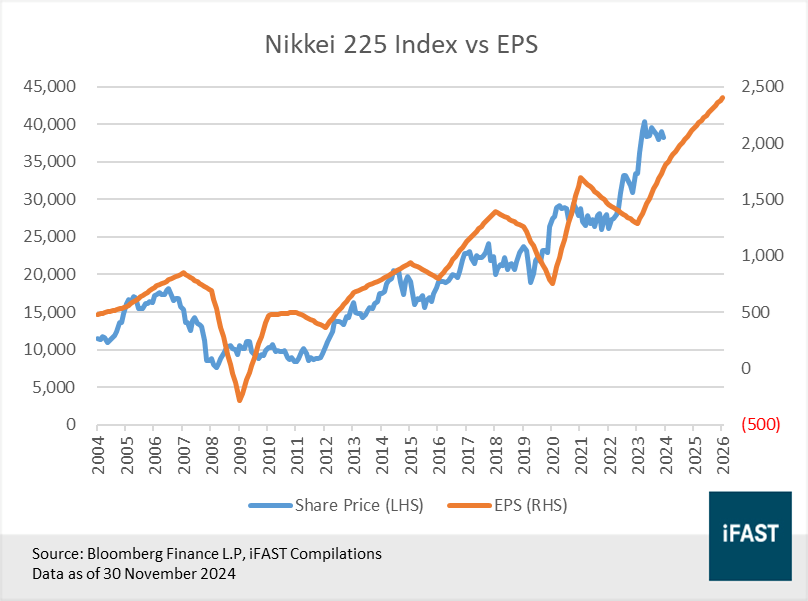
Table 7: Recommended products for Japan
|
Recommended Products |
|
|
ETF |
Xtrackers Nikkei 225 UCITS ETF 1D (LSE:XDJP) |
|
Unit Trust |
|
6. Consider Japan small-caps as tactical idea to complement large-cap exposure.
• Investors may consider Japan small-caps as a tactical idea to complement the large-cap focused Nikkei 225. Small caps are becoming increasingly attractive due to their domestic orientation, positioning them well to benefit from Japan’s improving economic strength and a potentially stronger yen.
• Additionally, corporate governance reforms are likely to support growth within the small-cap sector. In response to pressure from the Tokyo Stock Exchange, 95% of companies with market capitalisations between JPY 25 and 200 billion have disclosed initiatives to improve their long-term capital efficiency as of 30 September 2024.
• When it comes to global small-caps, high debt levels are typically a concern. However, Japan’s small-cap sector stands out as a notable exception, with nearly 60% of companies in net cash positions. This not only positions them well to weather an environment of rising interest rates, but also supports higher capital expenditures, increased dividends and share buybacks as corporate governance reforms take hold.
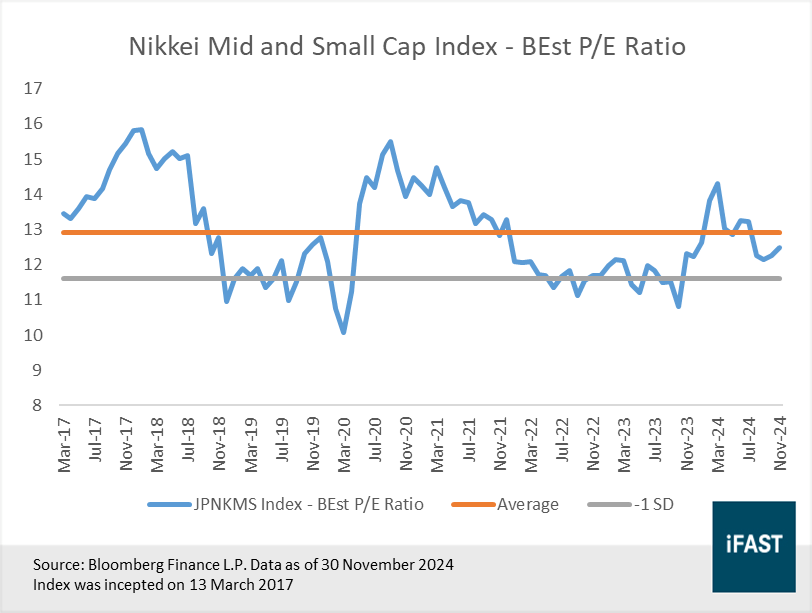
• Indices measuring small-caps, like the JPX-Nikkei Mid and Small Cap Index which has an average market capitalisation of JPY 75 billion, is trading at a forward PE ratio below the historical average. The undemanding valuations also come with positive forward earnings growth.
• Unlike large-caps, Japan small-caps receive significantly less sell-side coverage, creating opportunities for active managers to uncover mispriced opportunities. Our recommended fund is the Janus Henderson Horizon Japanese Smaller Companies A2 USD which aims to deliver long-term outperformance from the Japan small-cap market.
Figure 8: Valuations of Japan small caps look undemanding
7. China could potentially be this year’s dark horse if the government demonstrates its commitment to protecting the private sector
• China continues to face significant economic challenges, including low inflation, weak consumer demand, high local government debt, and a property crisis that remains far from resolved. In addition, there are long-term structural concerns, such as the shift toward a top-down, state-controlled economy, and abrupt policy changes that have eroded investor confidence. The rapid deterioration in US-China relations, which is likely to worsen following Donald Trump’s re-election, further adds to the downside risks for the economy.
• Given the long-term structural challenges facing China, we no longer consider it a core holding in investment portfolios. However, due to its position as the world's second-largest economy, there are still compelling reasons to keep China as a tactical allocation. With the right combination of short-term measures and long-term policy reforms, China could emerge as this year’s dark horse.
• Since 24 September, we have witnessed unprecedented policy coordination across various government agencies, aimed at addressing critical economic challenges, demonstrating a stronger commitment from the Chinese government to revitalising the economy. In the near-term, we believe that more stimulus measures could be introduced to support local government budgets and encourage spending. Policy measures to stabilise the property market could, in turn, lift consumer and investor sentiment and generate positive momentum in the stock market.
• However, stimulus alone will not be sufficient to sustain a rally. China is grappling with a confidence crisis—one that cannot be resolved merely through stimulus or a temporary surge in consumption. Long-term structural reforms are essential to restore confidence. Deregulation is crucial, not only in the housing market but, more importantly, in the capital markets.
• Greater support for the private sector is necessary, particularly in facilitating fundraising, improving access to capital, driving innovation, and enabling companies to scale. Strengthened earnings and growth prospects in the private sector will naturally create better employment opportunities for younger generations. We believe that these structural changes, if implemented, will set the stage for a re-rating of Chinese equities.
Table 8: Projections for the MSCI China Index
|
MSCI China Index |
2023 |
2024E |
2025E |
2026E |
|
Earnings Per Share (EPS) |
4.84 |
5.84 |
6.68 |
7.20 |
|
Earnings Growth YoY |
5.22% |
20.7% |
14.30% |
7.80% |
|
PE Ratio |
13.05 |
10.81 |
9.45 |
8.77 |
|
Upside Potential (based on a fair PE Ratio of 10X) |
- |
- |
- |
14.0% |
|
Source: Bloomberg Finance L.P., iFAST Compilations. Data as of 30 Nov 2024 |
||||
Figure 9: Share price vs. EPS chart for the MSCI China Index
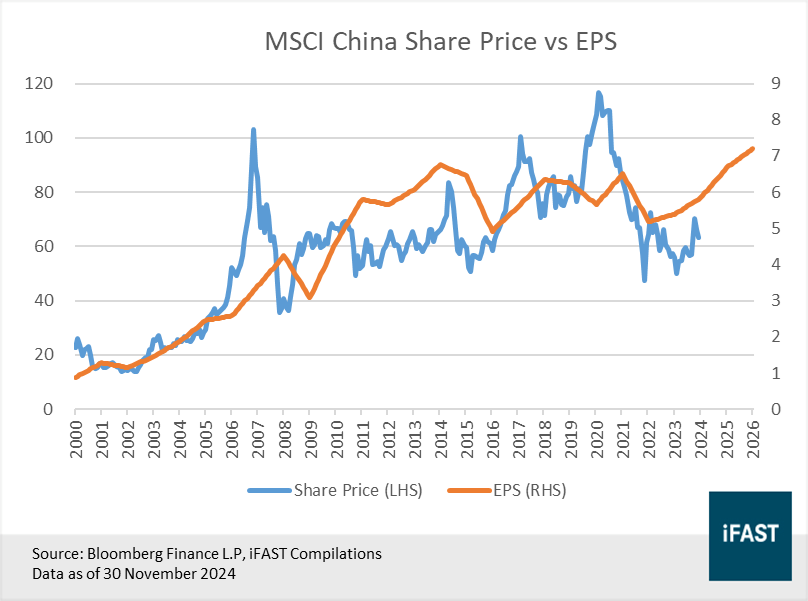
Table 9: Recommended products for China
|
Recommended Products |
|
|
ETF |
iShares Core MSCI China ETF (HKEX.2801) |
|
EFund Seeded CSI 300 ETF (SSE: 510310) |
|
|
Unit Trust |
|
8. Fixed income: Stick to short-duration, investment grade bonds. Be selective in high yield space.
• As major sovereign curves remain inverted, coupled with our expectations of elevated global benchmark rates in 2025, we continue to prefer short-duration bonds. Yields on short duration bonds remain elevated relative to history while the yields on longer duration bonds do not give investors sufficient compensation for taking additional maturity and duration risk. We believe that short-term bond yields are likely to remain elevated next year with policymakers being conservative towards cutting rates.
• Our recommendations for short-duration products are ‘Singapore-Centric’ funds like Nikko AM Shenton Short Term Bond Fund and United SGD Fund. Investors should also strongly consider cash and money market solutions like Fullerton SGD Cash Fund and Amundi Funds Cash USD depending on the preferred currency.
• Despite rate cuts across major central banks, yields for investment grade (IG) bonds remain attractive as compared to the past decade, supporting total returns. In particular, IG corporate bonds offer a much higher yield of around 4.6% (on an index level), which is near the 87th percentile over the same period. High quality bonds often trade at lower yields due to narrower credit spreads, assuming bonds of the same tenor and currency. However, with today’s yield backdrop, investors have the opportunity to pocket high quality bonds at appealing yields.
• Fundamentals for IG issuers remain strong, as corporate earnings are resilient while the cost of debt remains manageable. Overall, we remain positive on IG bonds entering 2025 and see this as one of the rare opportunities across history where investors can pocket high quality bonds atappealing yields. We recommend a global approach through the Allianz Global Opportunistic Bond Fund, for a majority global IG sovereign bond strategy, or the Capital Group Global Corporate Bond Fund for a more pure-play, global IG corporate credit strategy.
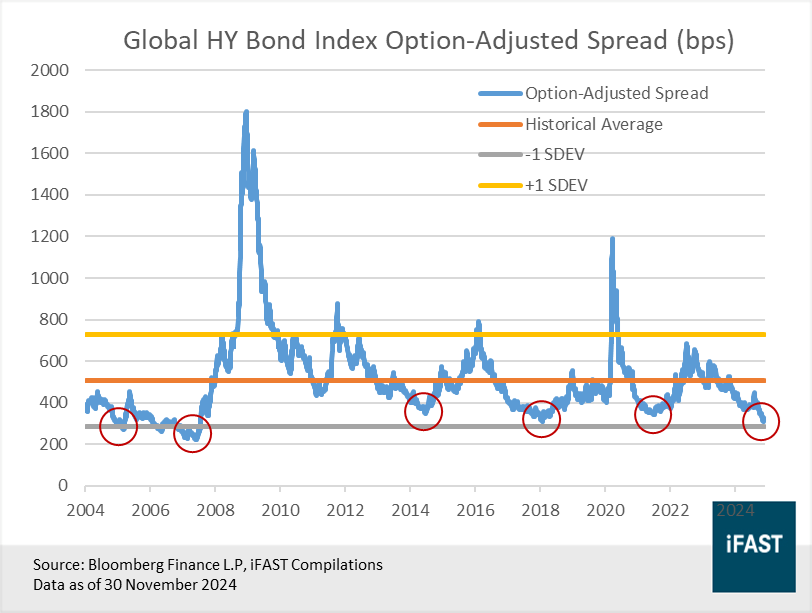
• Even amidst the challenging macro backdrop, fundamentals for HY issuers have improved across the year and we expect default rates to fall. Absolute yields for global HY bonds remain attractive at around 7.4% (on an index level), above the historical average. However, valuations are tight, and even tighter than its IG counterpart. Credit spreads for global HY bonds have compressed significantly and is trading around -1.5 standard deviation below its long-term average (Figure 10). With spreads around their historical low, we see limited room for further compression. On balance, we recommend investors to stay selective for global HY bonds and recommend an active approach through the PIMCO Global High Yield Bond Fund.
Figure 10: Credit spreads for global high yield bonds are tight
9. Consider adding duration when the yield curve normalises.
• Global benchmark rates will likely remain high in 2025 despite rate cuts across major central banks. Anchored by our macro view of a resilient US labour market and bumpy descent in inflation next year, we expect the Fed to adopt a cautious stance towards rate cuts. Global sovereign curves are normalising as long-end yields gradually rise, transitioning away from a deeply inverted state. Peering ahead, we think sovereign curves may continue to flatten but will likely take time before we see a more positive and steeper slope.
• While we expect further Fed rate cuts in 2025 if economic data moderates, this does not guarantee strong gains in long-duration bonds. Despite the Fed already cutting rates, 10y UST yields are up by +28 bps year-to-date. An investor who had bought the benchmark 10y UST one month before the Fed rate cut would have lost -0.9%, while those who bought right before the Fed cut rates would have suffered an even larger loss of -3.1% (Table 10).
Table 10: Investors betting on longer duration bonds would have lost money even as the Fed lowered rates
|
When you decided to buy the 10Y UST |
Time Period |
Change in Yield |
Price return |
Total return* (includes coupons) |
|
1 month before Fed meeting (16 Aug) |
16 Aug to 29 Nov (3.5 months) |
+0.28% |
-2.18% |
-0.89% |
|
Right before Fed meeting (17 Sep) |
17 Sep to 29 Nov (2.5 months) |
+0.54% |
-4.03% |
-3.1% |
|
Source: Bloomberg Finance L.P., iFAST Compilations Data as of 30 Nov 2024 |
||||
• Even if long-end UST yields fall, we see limited room for further declines as this would require markets to price in even more rate cuts in 2025. This may be challenging amidst a backdrop with multiple factors exerting upwards pressure on UST yields such as a potentially resilient US economy, pro-inflationary policies from Trump’s administration, and from the Fed’s ongoing reduction in reserve balances.
• Investors can look to turn positive on longer duration bonds when the US treasury curve steepens, and longer-term treasuries start to offer higher yields than their short-term counterparts. In terms of adding duration to their portfolios, we recommend investors to reallocate gradually instead of an all-in approach, such as a complete pivot from short to long duration bonds. Our reference rates to add duration gradually is when the 10-year UST yield approaches 4.5% - 5.0%.
10. Currency views: Neutral on the USD, positive on the JPY, SGD, and MYR.
• We remain neutral on the USD in 2025. On one hand, the prospect for higher-for-longer rates amidst persistently elevated inflation (above 2%) should help to support rate differentials, considering developed markets like Europe and the UK are facing relatively greater growth headwinds. On the other hand, valuations (using real effective exchange rates) remain stretched (Figure 11), potentially limiting significant upside for the USD against its main trading partners.
• Long-term factors to consider include the US’s persistent and worsening twin deficits, and potential signs of countries aiming to diversify away from the USD extremely gradually. However, it is important to emphasise that such concerns and fears over the USD are already known factors that have existed for many years with the USD still gaining strength against most peers. We acknowledge it is hard to determine the exact timing when these factors might actually matter, though these factors will likely pose as continual downside risks for USD strength over the long term.
• Other currencies we are positive on in 2025 include the JPY, SGD, and MYR, with these countries poised to maintain healthy current accounts in the years ahead. Japan and Singapore are countries we have identified as the ‘New Asian Tigers’, due to their skilled workforce, conducive business environments, and world-class brands. Meanwhile, Malaysia’s electronics and commodities exports are expected to do well in 2025; it could also be a key beneficiary of reshoring trends from companies seeking to diversify supply chains, a process that could re-accelerate with the election of Trump in 2025.
• We also expect rate differentials to support the three currencies above. In Japan, the BOJ is expected to further tighten policy in 2025 (while many other central banks are cutting rates). In Singapore, policy settings are also unlikely to loosen significantly amidst steady growth momentum and still-elevated inflation. Finally in Malaysia, we expect the BNM to maintain rates with the economy still growing strongly (as of 2Q24).
Figure 11: USD valuations look stretched based on real effective exchange rates
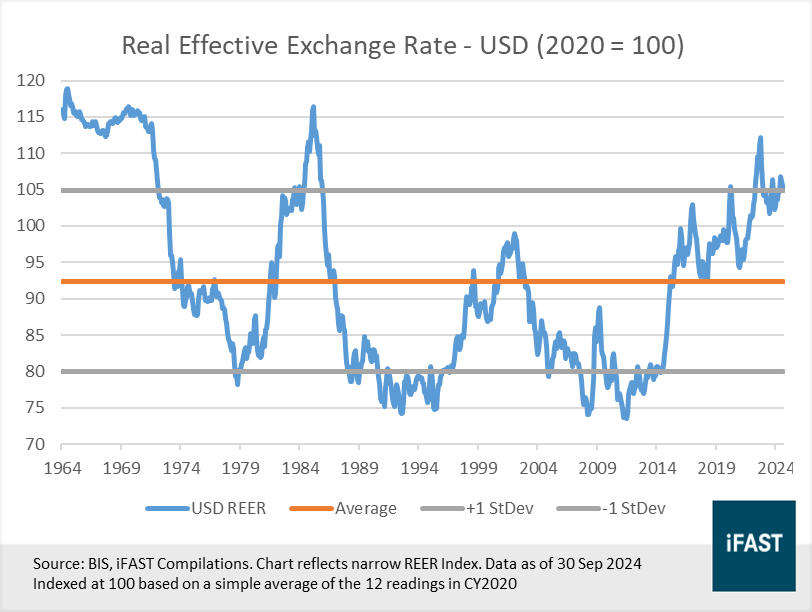
Figure 12: USD remains the premier currency for trade and FX reserves, despite efforts to diversify

' d='M0 0h300v57H0z'/%3e%3c/svg%3e "sgFsmLogoEnIcon")


'%3e%3cpath fill='%23fff' d='M0 0h21.6v21.6H0z'/%3e%3cg data-name='141-singapore'%3e%3cpath data-name='Rectangle 6502' fill='%23f0f0f0' d='M0 0h22v22H0z'/%3e%3cpath data-name='Rectangle 6503' fill='%23d80027' d='M0 0h22v10H0z'/%3e%3cg data-name='Group 21092' fill='%23f0f0f0'%3e%3cpath data-name='Path 14455' d='M2.917 5.365A3.128 3.128 0 015.374 2.31a3.128 3.128 0 100 6.11 3.128 3.128 0 01-2.457-3.055z'/%3e%3cpath data-name='Path 14456' d='M6.939 2.46l.222.683h.718l-.581.422.222.683-.581-.422-.581.422.222-.683-.581-.422h.718z'/%3e%3cpath data-name='Path 14457' d='M5.193 3.801l.222.683h.718l-.581.422.222.683-.581-.422-.581.422.222-.683-.581-.422h.718z'/%3e%3cpath data-name='Path 14458' d='M8.68 3.801l.222.683h.718l-.581.422.222.683-.581-.422-.581.422.222-.683-.581-.422h.718z'/%3e%3cpath data-name='Path 14459' d='M8.01 5.811l.222.683h.718l-.581.422.222.683-.581-.422-.581.422.222-.683-.581-.422h.718z'/%3e%3cpath data-name='Path 14460' d='M5.863 5.811l.222.683h.718l-.581.422.222.683-.581-.422-.581.422.222-.683-.581-.422h.718z'/%3e%3c/g%3e%3c/g%3e%3c/g%3e%3c/svg%3e "singaporeIcon")


' d='M0 0h67v14H0z'/%3e%3c/svg%3e "msFooterLogoIcon")
