


' fill='%23fff' stroke='%23707070' d='M0 0h21.6v21.6H0z'/%3e%3c/clipPath%3e%3cclipPath id='c'%3e%3cpath data-name='Rectangle 6531' transform='translate(-6319 -2048)' fill='%23fff' stroke='%23707070' d='M0 0h43.2v21.6H0z'/%3e%3c/clipPath%3e%3cclipPath id='a'%3e%3cpath d='M0 0h21.6v21.6H0z'/%3e%3c/clipPath%3e%3c/defs%3e%3cg data-name='Malaysia -Square' clip-path='url(%23a)'%3e%3cpath fill='%23fff' d='M0 0h21.6v21.6H0z'/%3e%3cg data-name='Mask Group 325' transform='translate(6348 2048)' clip-path='url(%23b)'%3e%3cg data-name='Mask Group 324' transform='translate(-35)' clip-path='url(%23c)'%3e%3cg data-name='Group 21195'%3e%3cpath data-name='Path 14718' d='M-6319-2048h43.2v21.6h-43.2z' fill='%23fff'/%3e%3cpath data-name='Path 14719' d='M-6317.457-2047.229h41.657m0 3.086h-41.657m0 3.086h41.657m0 3.086h-41.657' fill='none' stroke='%23c00' stroke-width='1.543'/%3e%3cpath data-name='Path 14720' d='M-6319-2048h21.6v13.114h-21.6z' fill='%23006'/%3e%3cpath data-name='Path 14721' d='M-6319-2034.886h43.2m0 3.086h-43.2m0 3.086h43.2' fill='none' stroke='%23c00' stroke-width='1.543'/%3e%3c/g%3e%3cpath data-name='Path 14722' d='M-6302.5-2045.686l.344 2.353 1.331-1.967-.714 2.269 2.054-1.2-1.626 1.731 2.372-.19-2.218.858 2.218.858-2.372-.19 1.626 1.736-2.054-1.2.714 2.269-1.331-1.97-.344 2.358-.344-2.353-1.331 1.97.714-2.269-2.054 1.2 1.626-1.737-2.372.19 2.218-.858-2.218-.859 2.372.19-1.626-1.736 2.054 1.2-.714-2.267 1.331 1.97zm-1.929.1a4.114 4.114 0 100 7.521 4.629 4.629 0 110-7.521z' fill='%23fc0'/%3e%3c/g%3e%3c/g%3e%3c/g%3e%3c/svg%3e "malaysiaIcon")
'%3e%3cpath fill='%23fff' d='M0 0h21.6v21.6H0z'/%3e%3cg data-name='067-hong-kong'%3e%3cpath data-name='Rectangle 6488' fill='%23d80027' d='M0 0h22v22H0z'/%3e%3cg data-name='Group 21086' fill='%23f0f0f0'%3e%3cpath data-name='Path 14432' d='M11.911 8.264c-.248 1.032-.689.835-.905 1.735a2.373 2.373 0 011.109-4.614c-.429 1.803.018 1.956-.204 2.879z'/%3e%3cpath data-name='Path 14433' d='M8.606 9.029c.9.555.581.913 1.37 1.4a2.373 2.373 0 01-4.045-2.481c1.577.964 1.866.586 2.675 1.081z'/%3e%3cpath data-name='Path 14434' d='M8.311 12.409c.807-.689 1.048-.271 1.752-.871a2.373 2.373 0 11-3.609 3.081c1.408-1.202 1.136-1.594 1.857-2.21z'/%3e%3cpath data-name='Path 14435' d='M11.435 13.734c-.406-.98.066-1.08-.287-1.935a2.373 2.373 0 111.815 4.385c-.708-1.71-1.165-1.573-1.528-2.45z'/%3e%3cpath data-name='Path 14436' d='M13.66 11.173c-1.058.083-1.007-.4-1.929-.325a2.373 2.373 0 114.731-.371c-1.846.145-1.856.621-2.802.696z'/%3e%3c/g%3e%3c/g%3e%3c/g%3e%3c/svg%3e "hongKongIcon")


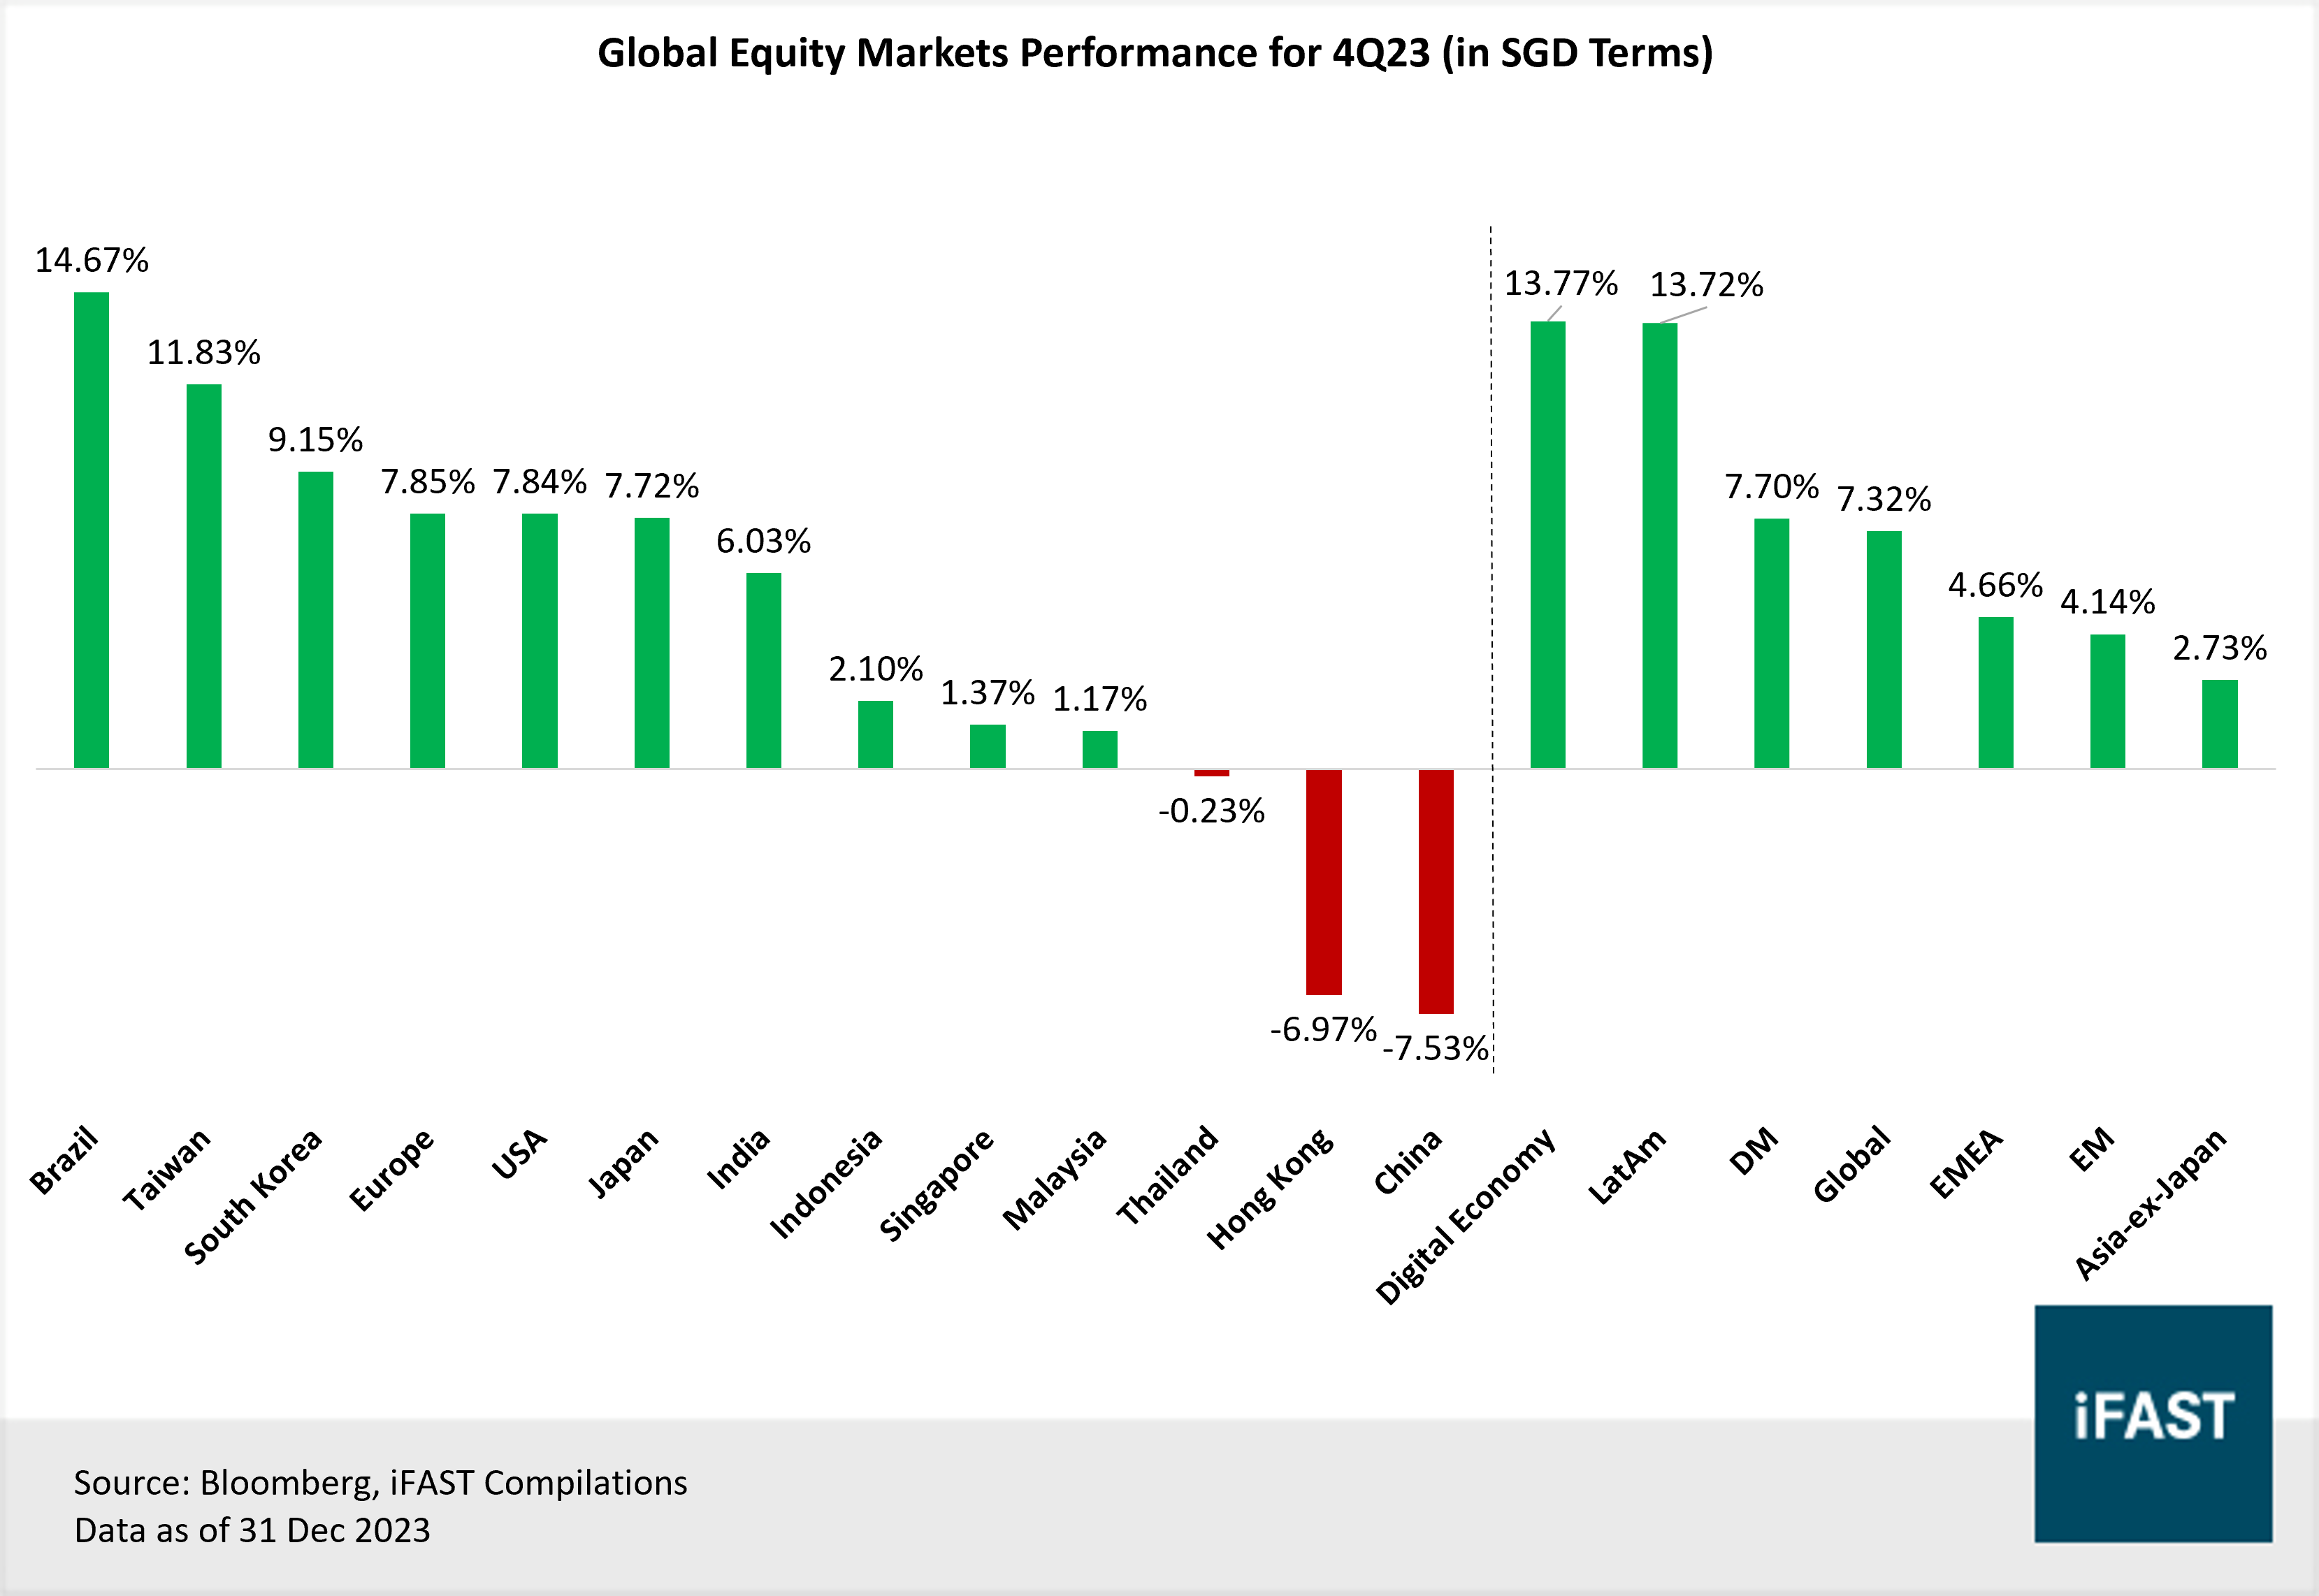
• Global equities had put up a strong performance in 4Q23, with the MSCI ACWI Index gaining +7.32% (in SGD terms).
• Brazil: A supportive monetary policy backdrop, a new fiscal framework to improve fiscal balances and a positive outlook for commodities bodes well for Brazil’s economy and corporate earnings.
• Taiwan: An uptick in the global semiconductor industry, and a rebound in exports growth has improved investor sentiments.
• China: China’s economy would continue to struggle, with consumer and business confidence remaining low, on top of a struggling real estate sector which would weigh on its growth.
• Hong Kong: Similar to China, we believe that ongoing economic and geopolitical risks would persist and dampen economic and corporate earnings growth.
Global equity markets closed off 2023 on a strong note, with most of them in the green across both developed and developing markets, and the MSCI ACWI index gaining by 7.32% (in SGD terms) in 4Q23.
On a single market level, the best performing markets in 4Q23 (in SGD terms) were Brazil (+14.67%) and Taiwan (+11.83%). On the other spectrum, the bottom performing markets were China (-7.53%) and Hong Kong (-6.97%).
Figure 1: 4Q23 global equities performance ranked (regions under coverage)
Brazil (+14.67% in SGD terms)
What drove 4Q23 performance?
Brazil’s equity market performed well in 4Q23, rising by +14.67% (in SGD terms), and rebounding from the -4.57% decline in 3Q23. The decision to loosen monetary policy by the Central Bank of Brazil creates a supportive backdrop for equities, especially at a time when central banks from other developed nations have yet to cut interest rates. Furthermore, Brazil’s economy also expanded more strongly than anticipated, with upwards revisions to its GDP, which improves investor sentiments and resulted in equity inflows.
Equity outlook:
Looking ahead, besides a supportive monetary policy backdrop, policy concerns have also moderated, with Brazil's lower house having approved a new fiscal framework proposed by President Luiz Inacio Lula da Silva, which is moving towards improving fiscal balances. Next, due to the region’s outsized influence by commodity prices, a positive outlook for commodities would also benefit Brazil’s economic growth and corporate earnings.
For instance, the medium to long-term outlook for green metals continues to look attractive, as the energy transition becomes a priority and represents a significant driver of incremental demand for copper, nickel, lithium, and other metals which are essential in renewable technologies.
Related article: Brazil: Look to this attractive market to outperform again
Figure 2: BOVESPA Index price vs EPS chart
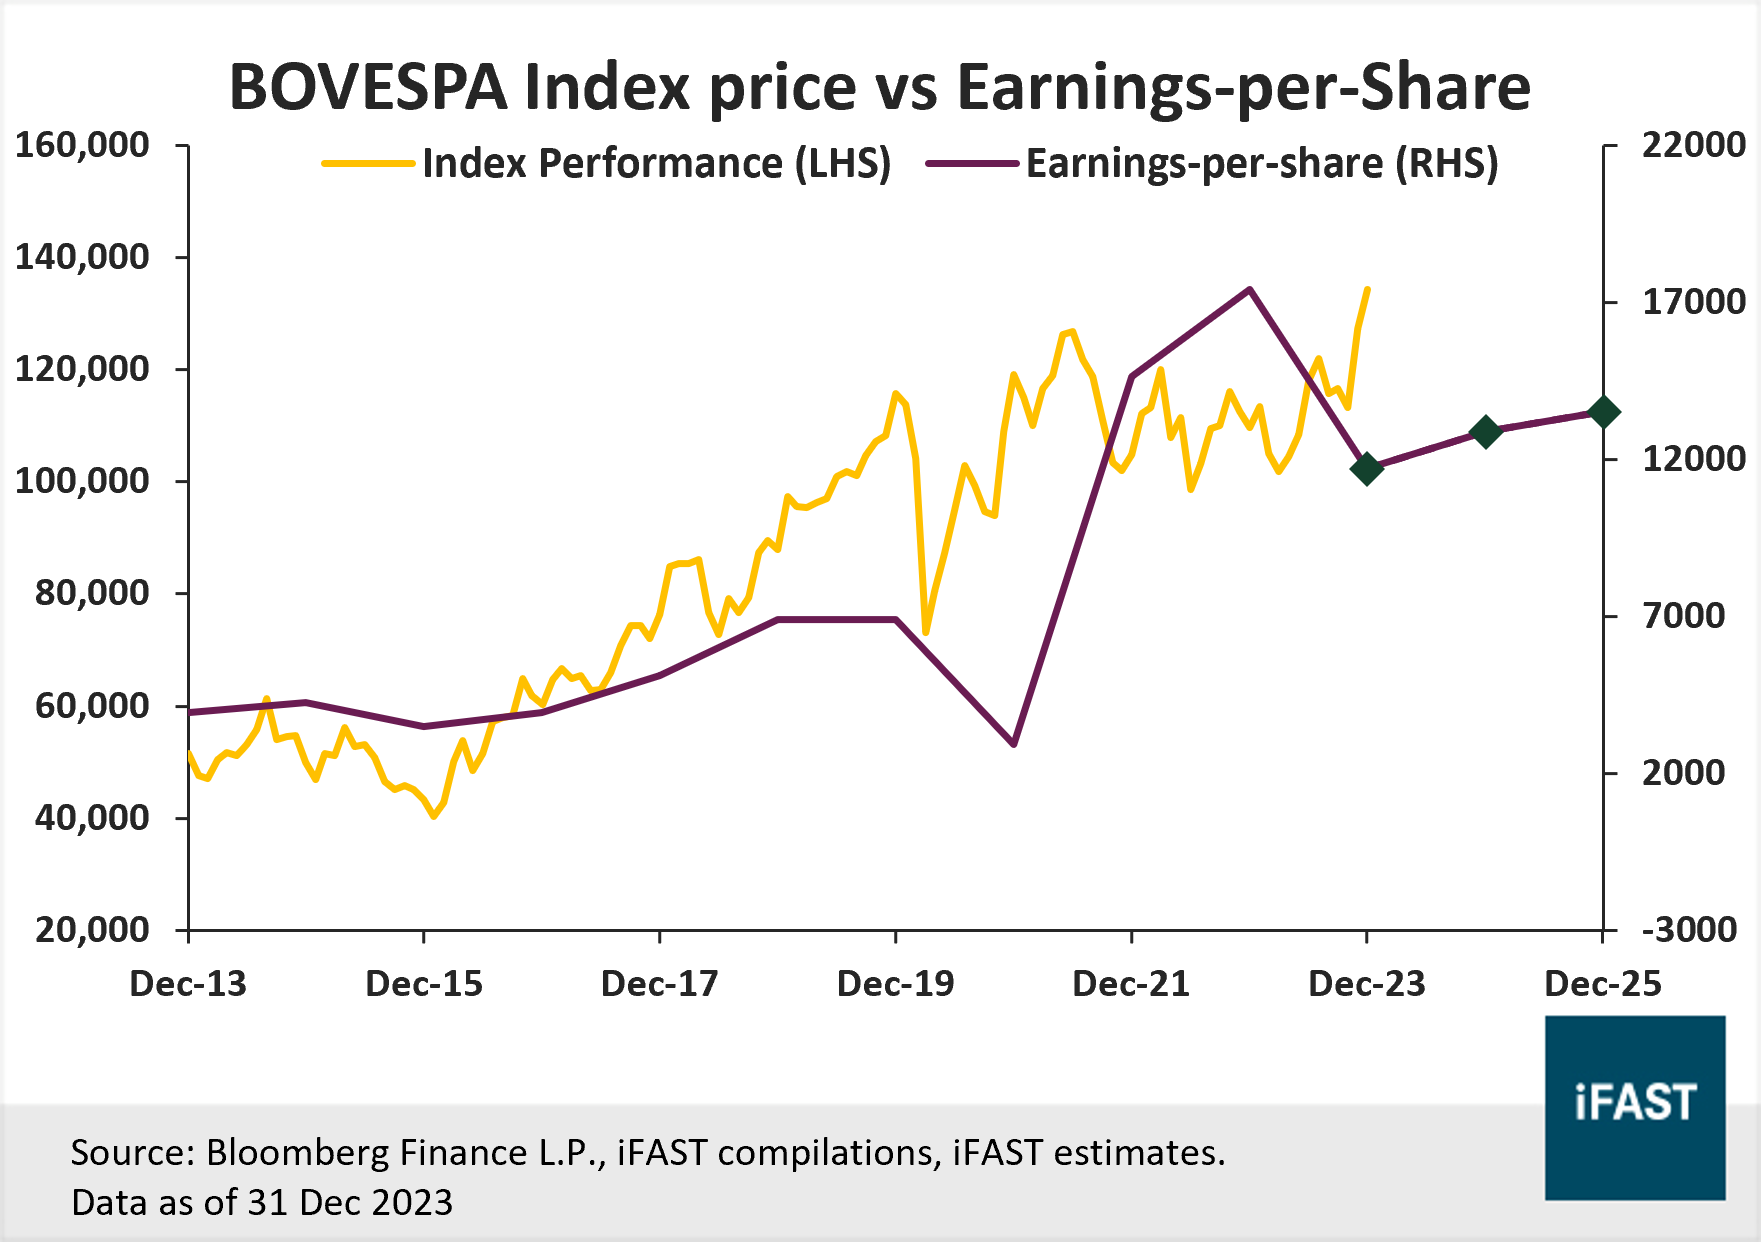
Table 1: EPS and projections for BOVESPA Index
|
Brazil (BOVESPA Index) |
2022 |
2023E |
2024E |
2025E |
|
PE Ratio (X) |
5.81 |
9.67 |
8.79 |
8.37 |
|
Earnings Growth |
17.0% |
-38.0% |
10.0% |
5.0% |
|
EPS |
18,873 |
11,701 |
12,871 |
13,515 |
|
Target Price (Based on fair PE ratio of 11.5X) |
- |
- |
- |
155,417 |
|
Upside Potential |
- |
- |
- |
15.8% |
|
Source: Bloomberg Finance L.P., iFAST Compilations. |
||||
Table 2: Recommended products
|
ETF |
Unit Trusts |
|
|
Brazil |
Taiwan (+11.93% in SGD terms)
What drove 4Q23 performance?
Taiwan’s equity market also performed well in 4Q23, gaining +11.93% (in SGD terms), rebounding from the -4.06% decline in 3Q23. Given that Taiwan produces over 60% of the world’s semiconductors and over 90% of the most advanced chips, signs that the global semiconductor industry is heading into an upcycle have buoyed investment sentiments. Furthermore, given that Taiwan’s economy is export-oriented with exports accounting for around 70% of total GDP, an upturn in exports growth has also improved its growth outlook.
Equity outlook:
As the world becomes increasingly digitalised, the demand for chips is expected to continue to rise. The surge in demand for semiconductors is anticipated to be driven largely by the widespread adoption of artificial intelligence (AI), reminiscent of the impact seen during past technological advancements such as the PC, smartphone, and the internet.
We expect Taiwan to experience substantial gains from the recovery in the semiconductor industry, especially with companies like TSMC leading as the primary choice for state-of-the-art chip manufacturing. Nevertheless, we also acknowledge the geopolitical risks in Taiwan, and escalating tensions could trigger a sell-off in Taiwanese equities.
Related article: Will the prospects of Asian equities improve after an underwhelming year?
Figure 3: TWSE Index price vs EPS chart
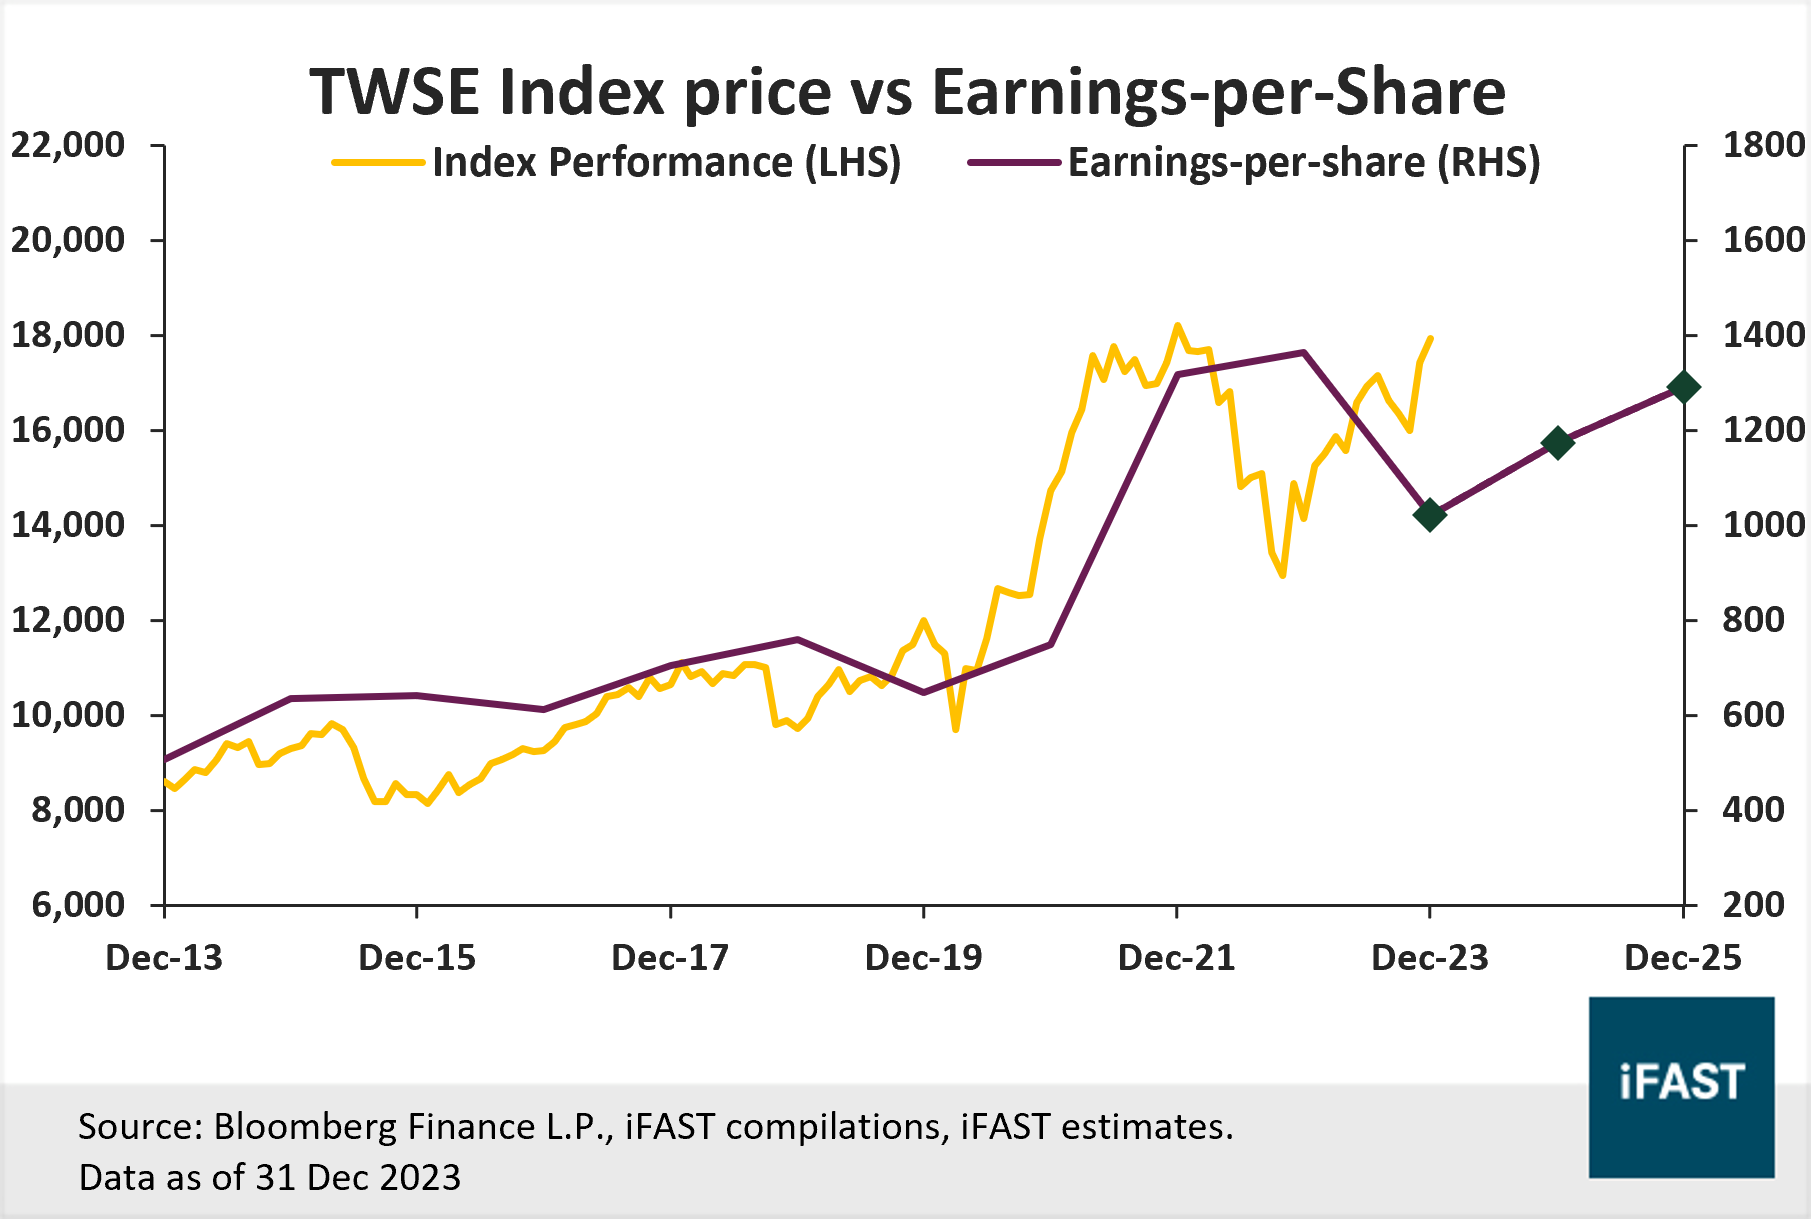
Table 3: EPS and projections for TWSE Index
|
Taiwan (TWSE Index) |
2022 |
2023E |
2024E |
2025E |
|
PE Ratio (X) |
13.2 |
17.6 |
15.3 |
13.9 |
|
Earnings Growth |
13.2% |
-25.0% |
15.0% |
10.0% |
|
EPS |
1,362 |
1,021 |
1,174 |
1,292 |
|
Target Price (Based on fair PE ratio of 17X) |
- |
- |
- |
21,964 |
|
Upside |
- |
- |
- |
22.5% |
|
Source: Bloomberg Finance L.P., iFAST Compilations. |
||||
Table 4: Recommended products
|
ETF |
Unit Trusts |
|
|
Taiwan |
- |
China (-7.53% in SGD terms)
What drove 4Q23 performance?
China was the worst performer. Its equity market continued its slump in 4Q23, losing -7.53% (in SGD terms) after a -0.81% decline in 3Q23. This is on the back of fragile consumer and business confidence, which weakens investor sentiments. Furthermore, China’s property market is faced with persistent challenges, and is anticipated to decline further due to sluggish purchasing demand.
Equity outlook:
Besides the ongoing economic pain points, there are also longer-term structural issues to worry about, particularly China’s embrace of a top-down state-controlled growth model and a deterioration in US-China relations. While we expect a more expansionary fiscal stance and further relaxation of the monetary policy regime in 2024, we believe that it will take time to observe the effectiveness of these policies. All in all, we believe that China is in a structural decline, and in the absence of any significant reforms, a quick turnaround is unlikely.
Due to geopolitical uncertainty and a weakening economic landscape, we believe it is important for investors to align their portfolios with China’s priorities: that means investing more in SOEs and companies that operate in favoured industries (e.g. green energy, electric vehicles, and advanced manufacturing). Most of these companies are found in the A-shares market, which should be relatively more resilient compared to the offshore market where foreign investor confidence remains fragile. Therefore, investors that still interested in investing in China can consider either the E-Fund CSI 300 ETF (SSE:510310) or the Allianz China A Shares Fund.
Related article: Riding the Chinese dragon in 2024? It’s no easy feat!
Figure 4: MXCN Index price vs EPS chart
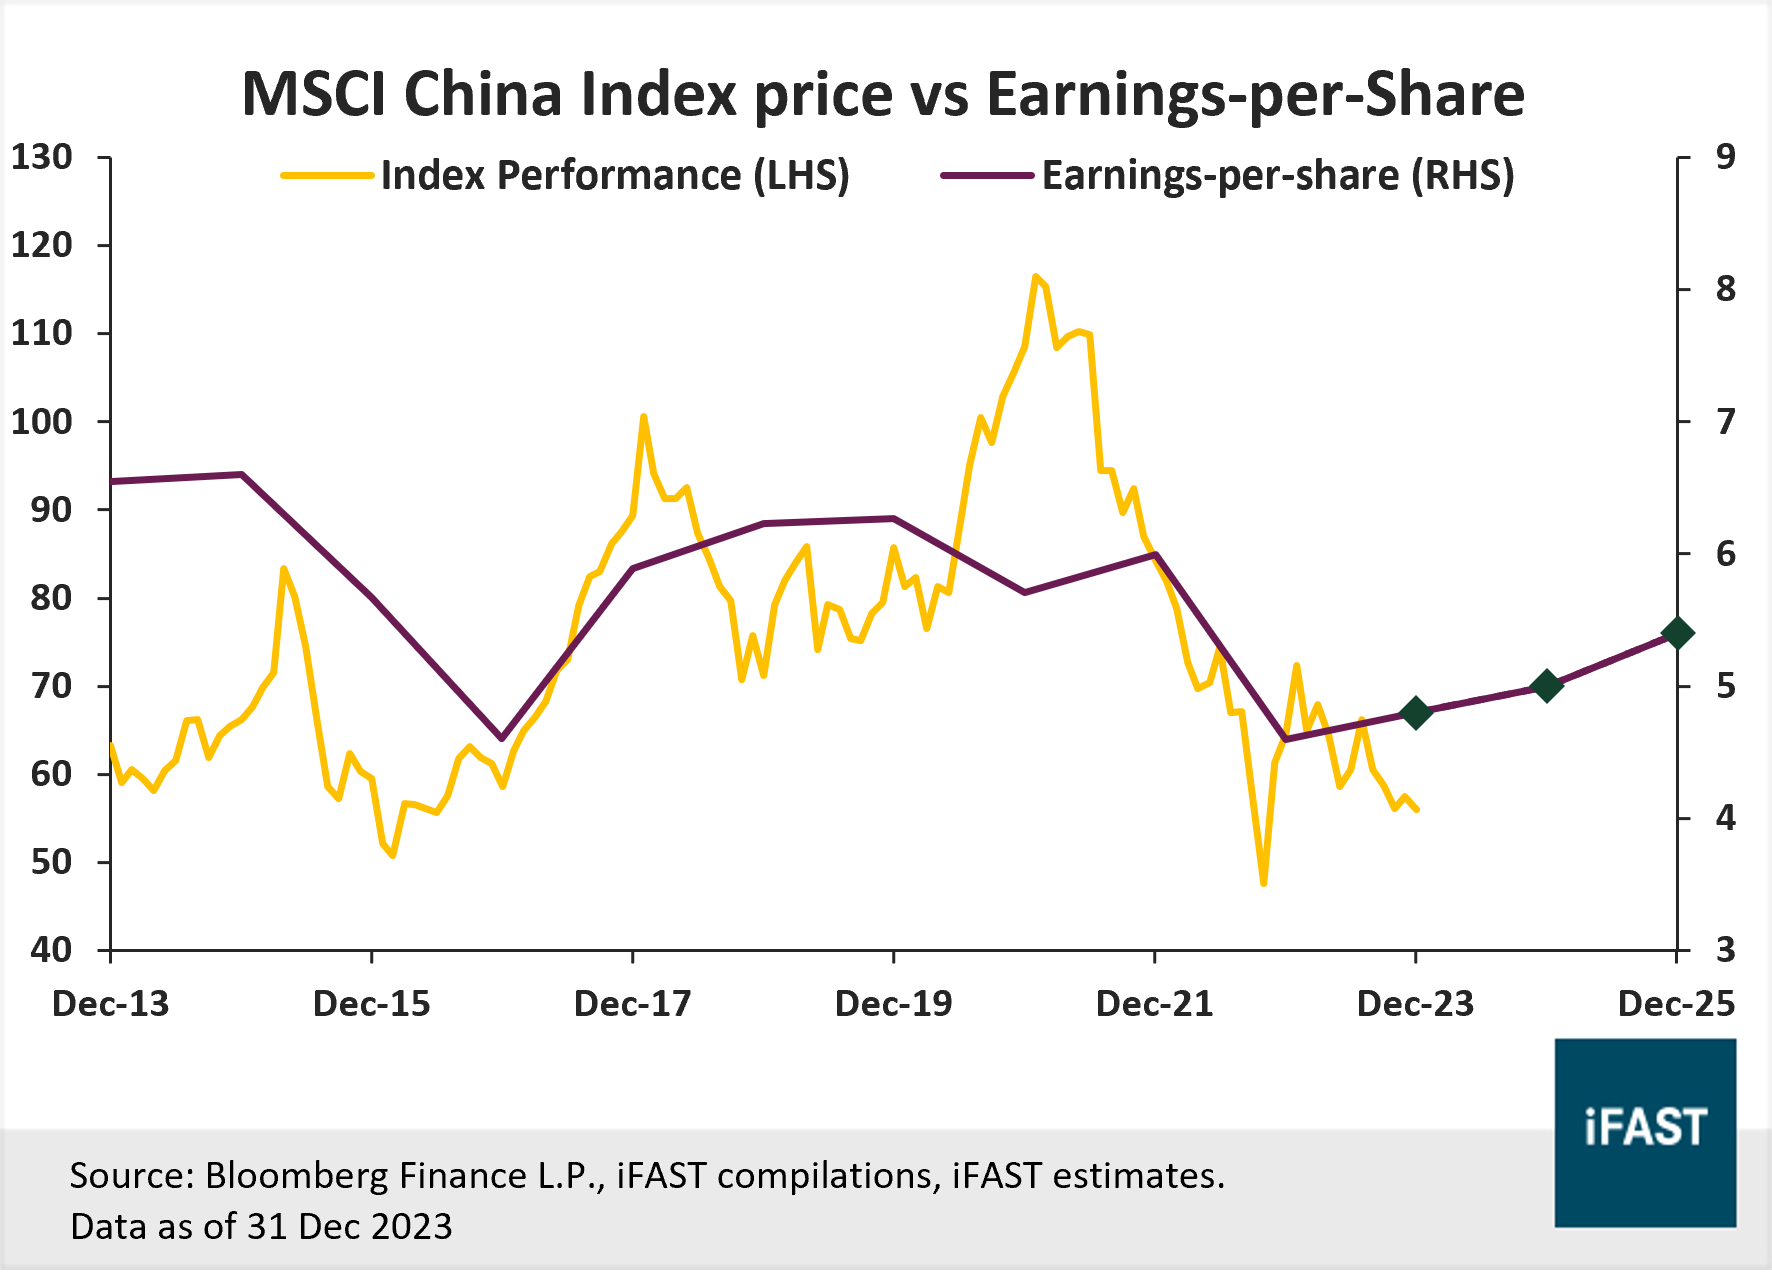
Table 5: EPS and projections for MCXN Index
|
China (MSCI China Index) |
2022 |
2023E |
2024E |
2025E |
|
PE Ratio (X) |
12.2 |
11.7 |
11.2 |
10.4 |
|
Earnings Growth |
-16.6% |
1.4% |
3.2% |
6.8% |
|
EPS |
4.6 |
4.8 |
5.0 |
5.4 |
|
Target Price (Based on fair PE ratio of 10X) |
- |
- |
- |
53.8 |
|
Upside Potential |
- |
- |
- |
-3.8% |
|
Source: Bloomberg Finance L.P., iFAST Compilations. |
||||
Table 6: Recommended products
|
ETF |
Unit Trusts |
|
|
China |
Hong Kong (-6.97% in SGD terms)
What drove 4Q23 performance?
Hong Kong’s equity market also continued its downward trajectory in 4Q23, declining by -6.97% (in SGD terms), after a -3.11% decline in 3Q23. Since there is a strong overlap between the Hang Seng index and the MSCI China index, a weak performance by constituents in the Chinese market also resulted in poor performance for Hong Kong’s market.
Equity outlook:
Similar to our outlook for China, we continue to hold a negative view on the Hong Kong markets, given the murky economic climate and ongoing geopolitical tensions. While the government has pledged more stimulus measures, they are far from being a game changer. Without large targeted reforms that will put Hong Kong’s economy on a more sustainable growth path, the lack of new growth drivers, coupled with weak imports and exports, would continue to weigh on corporate earnings and the region’s growth prospects.
Nevertheless, if investors wish to invest in the Hong Kong equity market, they can consider the Tracker Fund of Hong Kong (HKEX:2800).
Figure 5: HSI Index price vs EPS chart
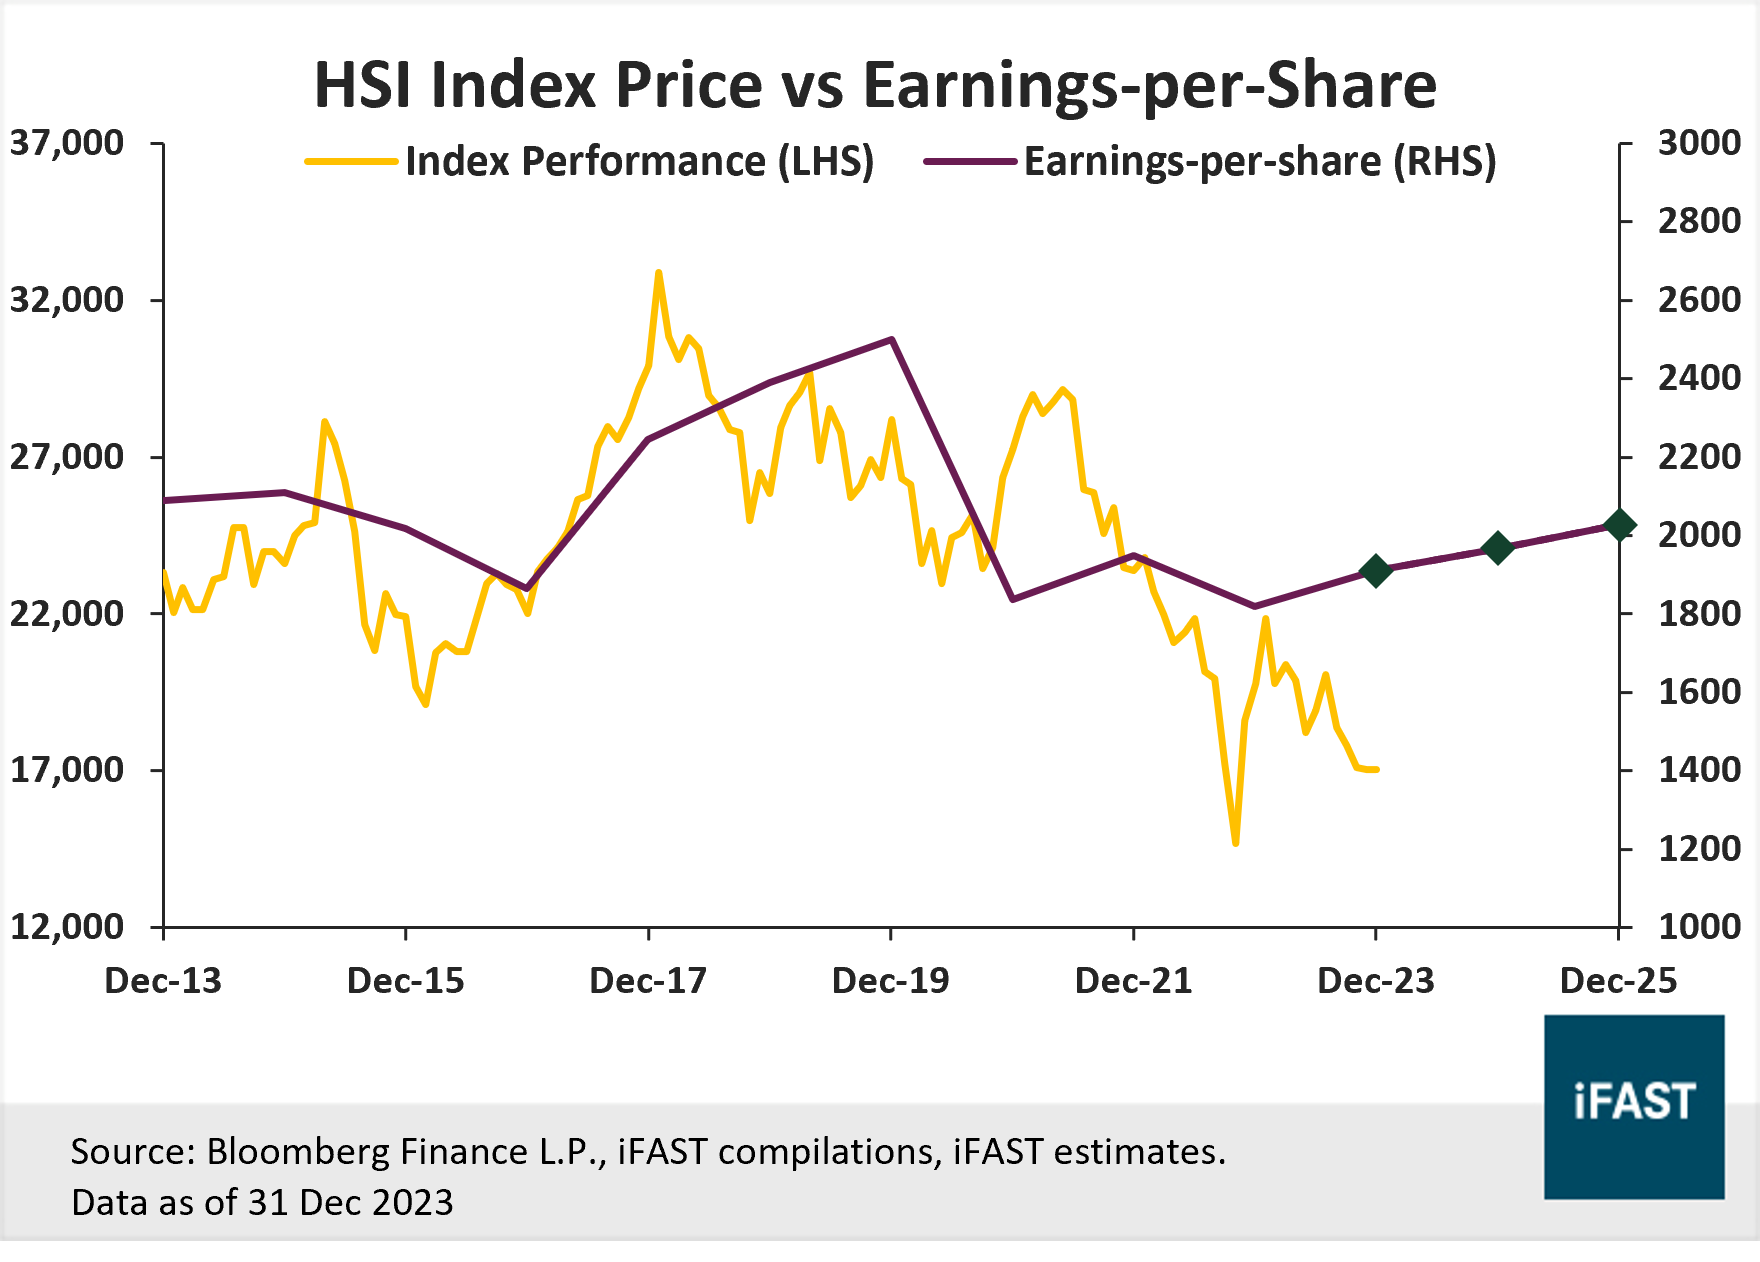
Table 7: EPS and projections for HSI Index
|
Hong Kong (HSI Index) |
2022 |
2023E |
2024E |
2025E |
|
PE Ratio (X) |
9.4 |
8.9 |
8.7 |
8.4 |
|
Earnings Growth |
-7.0% |
5.0% |
3.0% |
3.0% |
|
EPS |
1,819 |
1,910 |
1,968 |
2,027 |
|
Target Price (Based on fair PE ratio of 9X) |
- |
- |
- |
18,241 |
|
Upside Potential |
- |
- |
- |
7.0% |
|
Source: Bloomberg Finance L.P., iFAST Compilations. |
||||
Table 8: Recommended products
|
ETF |
Unit Trusts |
|
|
Hong Kong |
- |
Declaration:
For specific disclosure, at the time of publication of this report, IFPL (via its connected and associated entities) and the analyst who produced this report hold a NIL position in the abovementioned securities.

' d='M0 0h300v57H0z'/%3e%3c/svg%3e "sgFsmLogoEnIcon")


'%3e%3cpath fill='%23fff' d='M0 0h21.6v21.6H0z'/%3e%3cg data-name='141-singapore'%3e%3cpath data-name='Rectangle 6502' fill='%23f0f0f0' d='M0 0h22v22H0z'/%3e%3cpath data-name='Rectangle 6503' fill='%23d80027' d='M0 0h22v10H0z'/%3e%3cg data-name='Group 21092' fill='%23f0f0f0'%3e%3cpath data-name='Path 14455' d='M2.917 5.365A3.128 3.128 0 015.374 2.31a3.128 3.128 0 100 6.11 3.128 3.128 0 01-2.457-3.055z'/%3e%3cpath data-name='Path 14456' d='M6.939 2.46l.222.683h.718l-.581.422.222.683-.581-.422-.581.422.222-.683-.581-.422h.718z'/%3e%3cpath data-name='Path 14457' d='M5.193 3.801l.222.683h.718l-.581.422.222.683-.581-.422-.581.422.222-.683-.581-.422h.718z'/%3e%3cpath data-name='Path 14458' d='M8.68 3.801l.222.683h.718l-.581.422.222.683-.581-.422-.581.422.222-.683-.581-.422h.718z'/%3e%3cpath data-name='Path 14459' d='M8.01 5.811l.222.683h.718l-.581.422.222.683-.581-.422-.581.422.222-.683-.581-.422h.718z'/%3e%3cpath data-name='Path 14460' d='M5.863 5.811l.222.683h.718l-.581.422.222.683-.581-.422-.581.422.222-.683-.581-.422h.718z'/%3e%3c/g%3e%3c/g%3e%3c/g%3e%3c/svg%3e "singaporeIcon")


' d='M0 0h67v14H0z'/%3e%3c/svg%3e "msFooterLogoIcon")
