


' fill='%23fff' stroke='%23707070' d='M0 0h21.6v21.6H0z'/%3e%3c/clipPath%3e%3cclipPath id='c'%3e%3cpath data-name='Rectangle 6531' transform='translate(-6319 -2048)' fill='%23fff' stroke='%23707070' d='M0 0h43.2v21.6H0z'/%3e%3c/clipPath%3e%3cclipPath id='a'%3e%3cpath d='M0 0h21.6v21.6H0z'/%3e%3c/clipPath%3e%3c/defs%3e%3cg data-name='Malaysia -Square' clip-path='url(%23a)'%3e%3cpath fill='%23fff' d='M0 0h21.6v21.6H0z'/%3e%3cg data-name='Mask Group 325' transform='translate(6348 2048)' clip-path='url(%23b)'%3e%3cg data-name='Mask Group 324' transform='translate(-35)' clip-path='url(%23c)'%3e%3cg data-name='Group 21195'%3e%3cpath data-name='Path 14718' d='M-6319-2048h43.2v21.6h-43.2z' fill='%23fff'/%3e%3cpath data-name='Path 14719' d='M-6317.457-2047.229h41.657m0 3.086h-41.657m0 3.086h41.657m0 3.086h-41.657' fill='none' stroke='%23c00' stroke-width='1.543'/%3e%3cpath data-name='Path 14720' d='M-6319-2048h21.6v13.114h-21.6z' fill='%23006'/%3e%3cpath data-name='Path 14721' d='M-6319-2034.886h43.2m0 3.086h-43.2m0 3.086h43.2' fill='none' stroke='%23c00' stroke-width='1.543'/%3e%3c/g%3e%3cpath data-name='Path 14722' d='M-6302.5-2045.686l.344 2.353 1.331-1.967-.714 2.269 2.054-1.2-1.626 1.731 2.372-.19-2.218.858 2.218.858-2.372-.19 1.626 1.736-2.054-1.2.714 2.269-1.331-1.97-.344 2.358-.344-2.353-1.331 1.97.714-2.269-2.054 1.2 1.626-1.737-2.372.19 2.218-.858-2.218-.859 2.372.19-1.626-1.736 2.054 1.2-.714-2.267 1.331 1.97zm-1.929.1a4.114 4.114 0 100 7.521 4.629 4.629 0 110-7.521z' fill='%23fc0'/%3e%3c/g%3e%3c/g%3e%3c/g%3e%3c/svg%3e "malaysiaIcon")
'%3e%3cpath fill='%23fff' d='M0 0h21.6v21.6H0z'/%3e%3cg data-name='067-hong-kong'%3e%3cpath data-name='Rectangle 6488' fill='%23d80027' d='M0 0h22v22H0z'/%3e%3cg data-name='Group 21086' fill='%23f0f0f0'%3e%3cpath data-name='Path 14432' d='M11.911 8.264c-.248 1.032-.689.835-.905 1.735a2.373 2.373 0 011.109-4.614c-.429 1.803.018 1.956-.204 2.879z'/%3e%3cpath data-name='Path 14433' d='M8.606 9.029c.9.555.581.913 1.37 1.4a2.373 2.373 0 01-4.045-2.481c1.577.964 1.866.586 2.675 1.081z'/%3e%3cpath data-name='Path 14434' d='M8.311 12.409c.807-.689 1.048-.271 1.752-.871a2.373 2.373 0 11-3.609 3.081c1.408-1.202 1.136-1.594 1.857-2.21z'/%3e%3cpath data-name='Path 14435' d='M11.435 13.734c-.406-.98.066-1.08-.287-1.935a2.373 2.373 0 111.815 4.385c-.708-1.71-1.165-1.573-1.528-2.45z'/%3e%3cpath data-name='Path 14436' d='M13.66 11.173c-1.058.083-1.007-.4-1.929-.325a2.373 2.373 0 114.731-.371c-1.846.145-1.856.621-2.802.696z'/%3e%3c/g%3e%3c/g%3e%3c/g%3e%3c/svg%3e "hongKongIcon")


Under the hood
The first thing to note is that carbon emissions can be classified into Scopes 1, 2 and 3.
Scope 1 is the most straightforward and generally refers to direct emissions produced by a company. Scope 2 refers to emissions produced by electricity generated or purchased by the company. When we discussed carbon intensity in the earlier article, we only included measures for Scopes 1 and 2.
This is a common practice as Scope 3 reporting is sparse whilst also the hardest to measure. Scope 3 refers to emissions that are in the company’s value chain and can be split into upstream (suppliers) and downstream (customers). According to the Greenhouse Gas Protocol1, most emissions come from Scope 3 and this could mean that “companies have been missing out on significant opportunities for improvement”.
To get a sense of the impact of Scope 3 emissions on total emissions, we look at the constituents of the MSCI AC World index. Fig 1 shows the average make-up of total emissions over the past three years2, ranked by the percentage of Scope 3 emissions.
Fig. 1. Breakdown of total emissions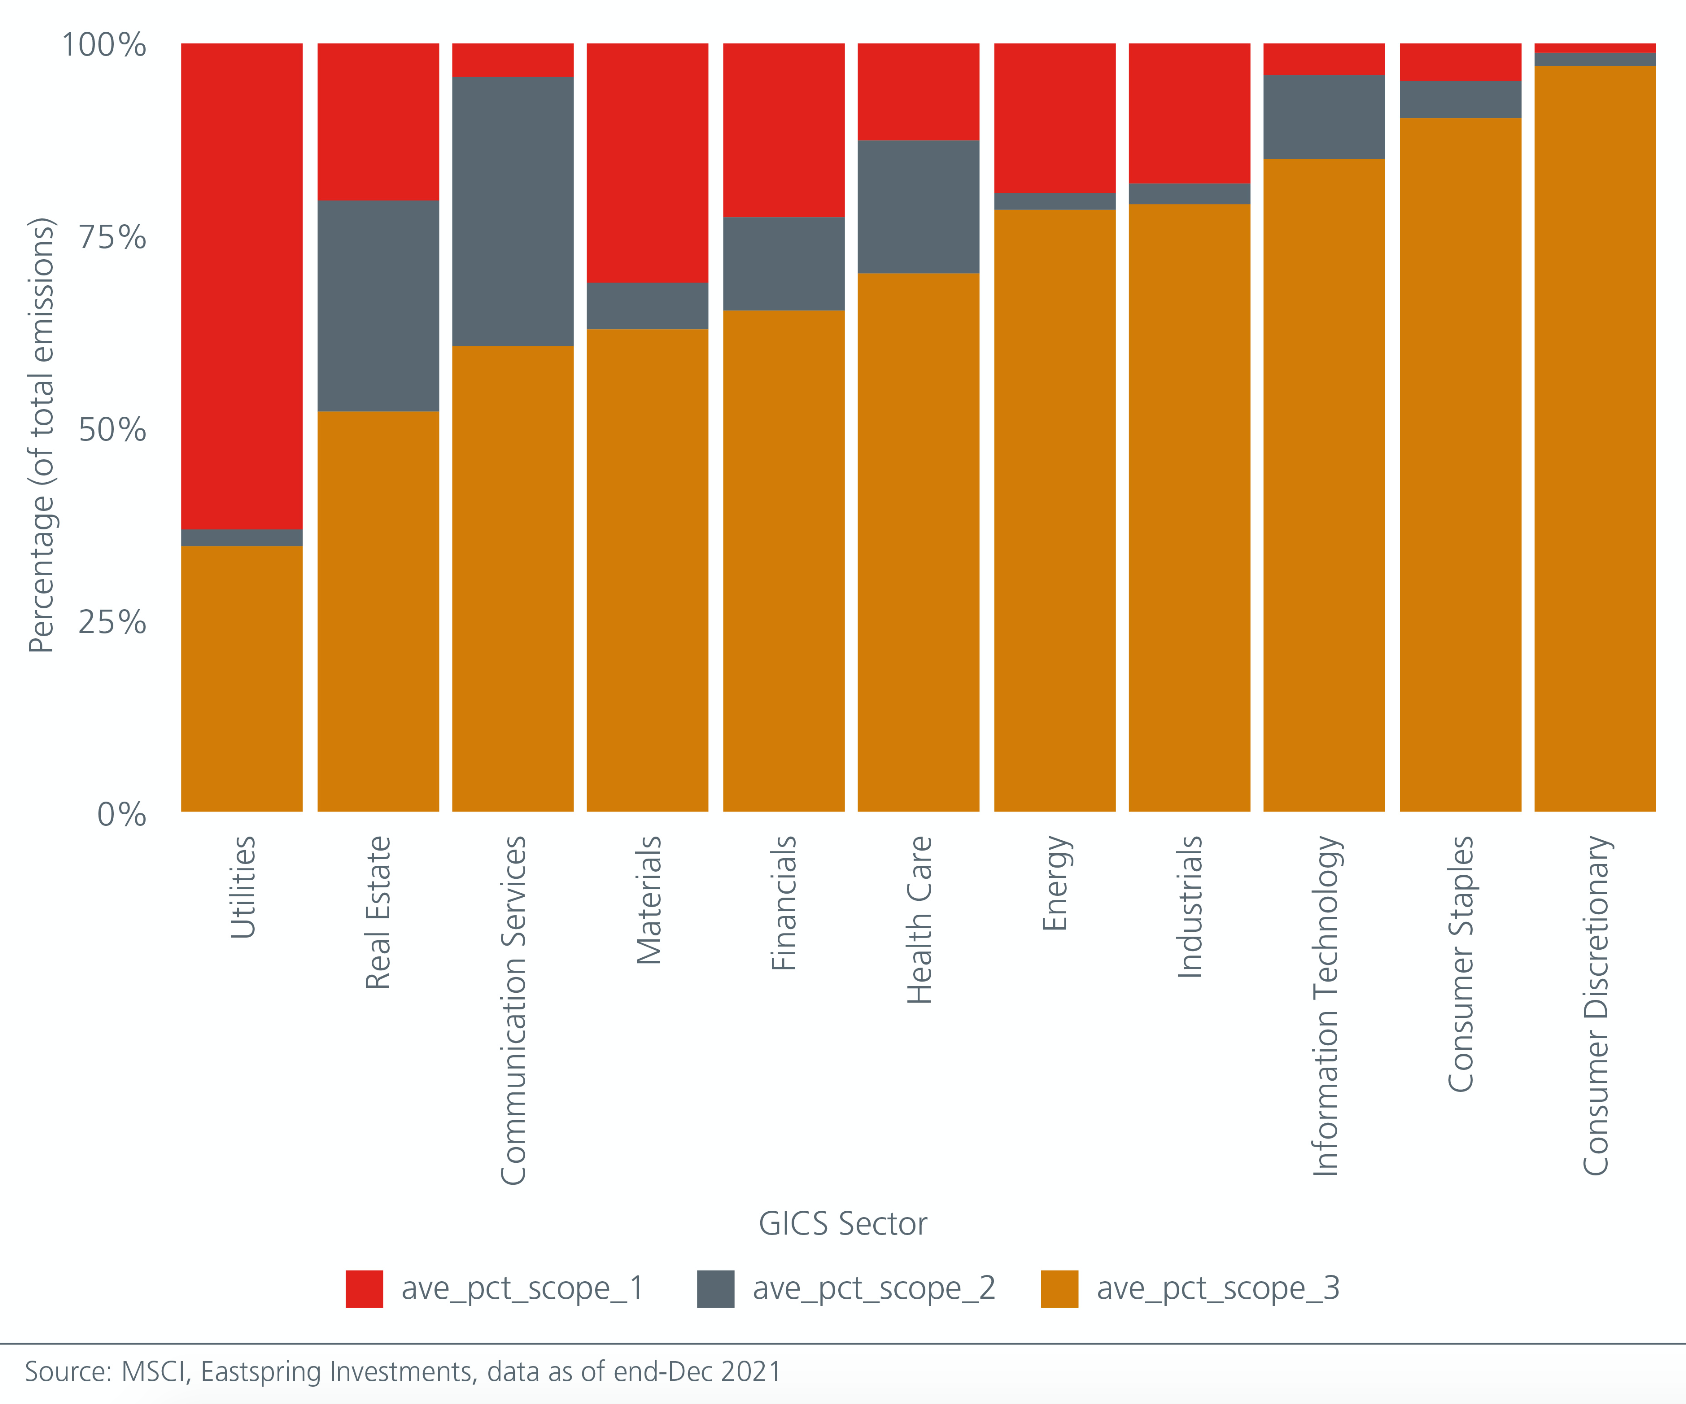
Perhaps unsurprisingly, companies in the Utilities and Materials sectors have a much larger proportion of their emissions captured in Scope 1, whereas product-focused sectors such as Consumer Staples and Consumer Discretionary, with their more complex value chains, see Scope 3 dominating total emissions.
What this means is that the reported emissions from Scopes 1 and 2 for some consumer-related companies may be understating their overall carbon footprint. As stricter regulations in carbon reporting require more companies to report Scope 3 emissions, these sectors will likely see the biggest jump in total emissions.
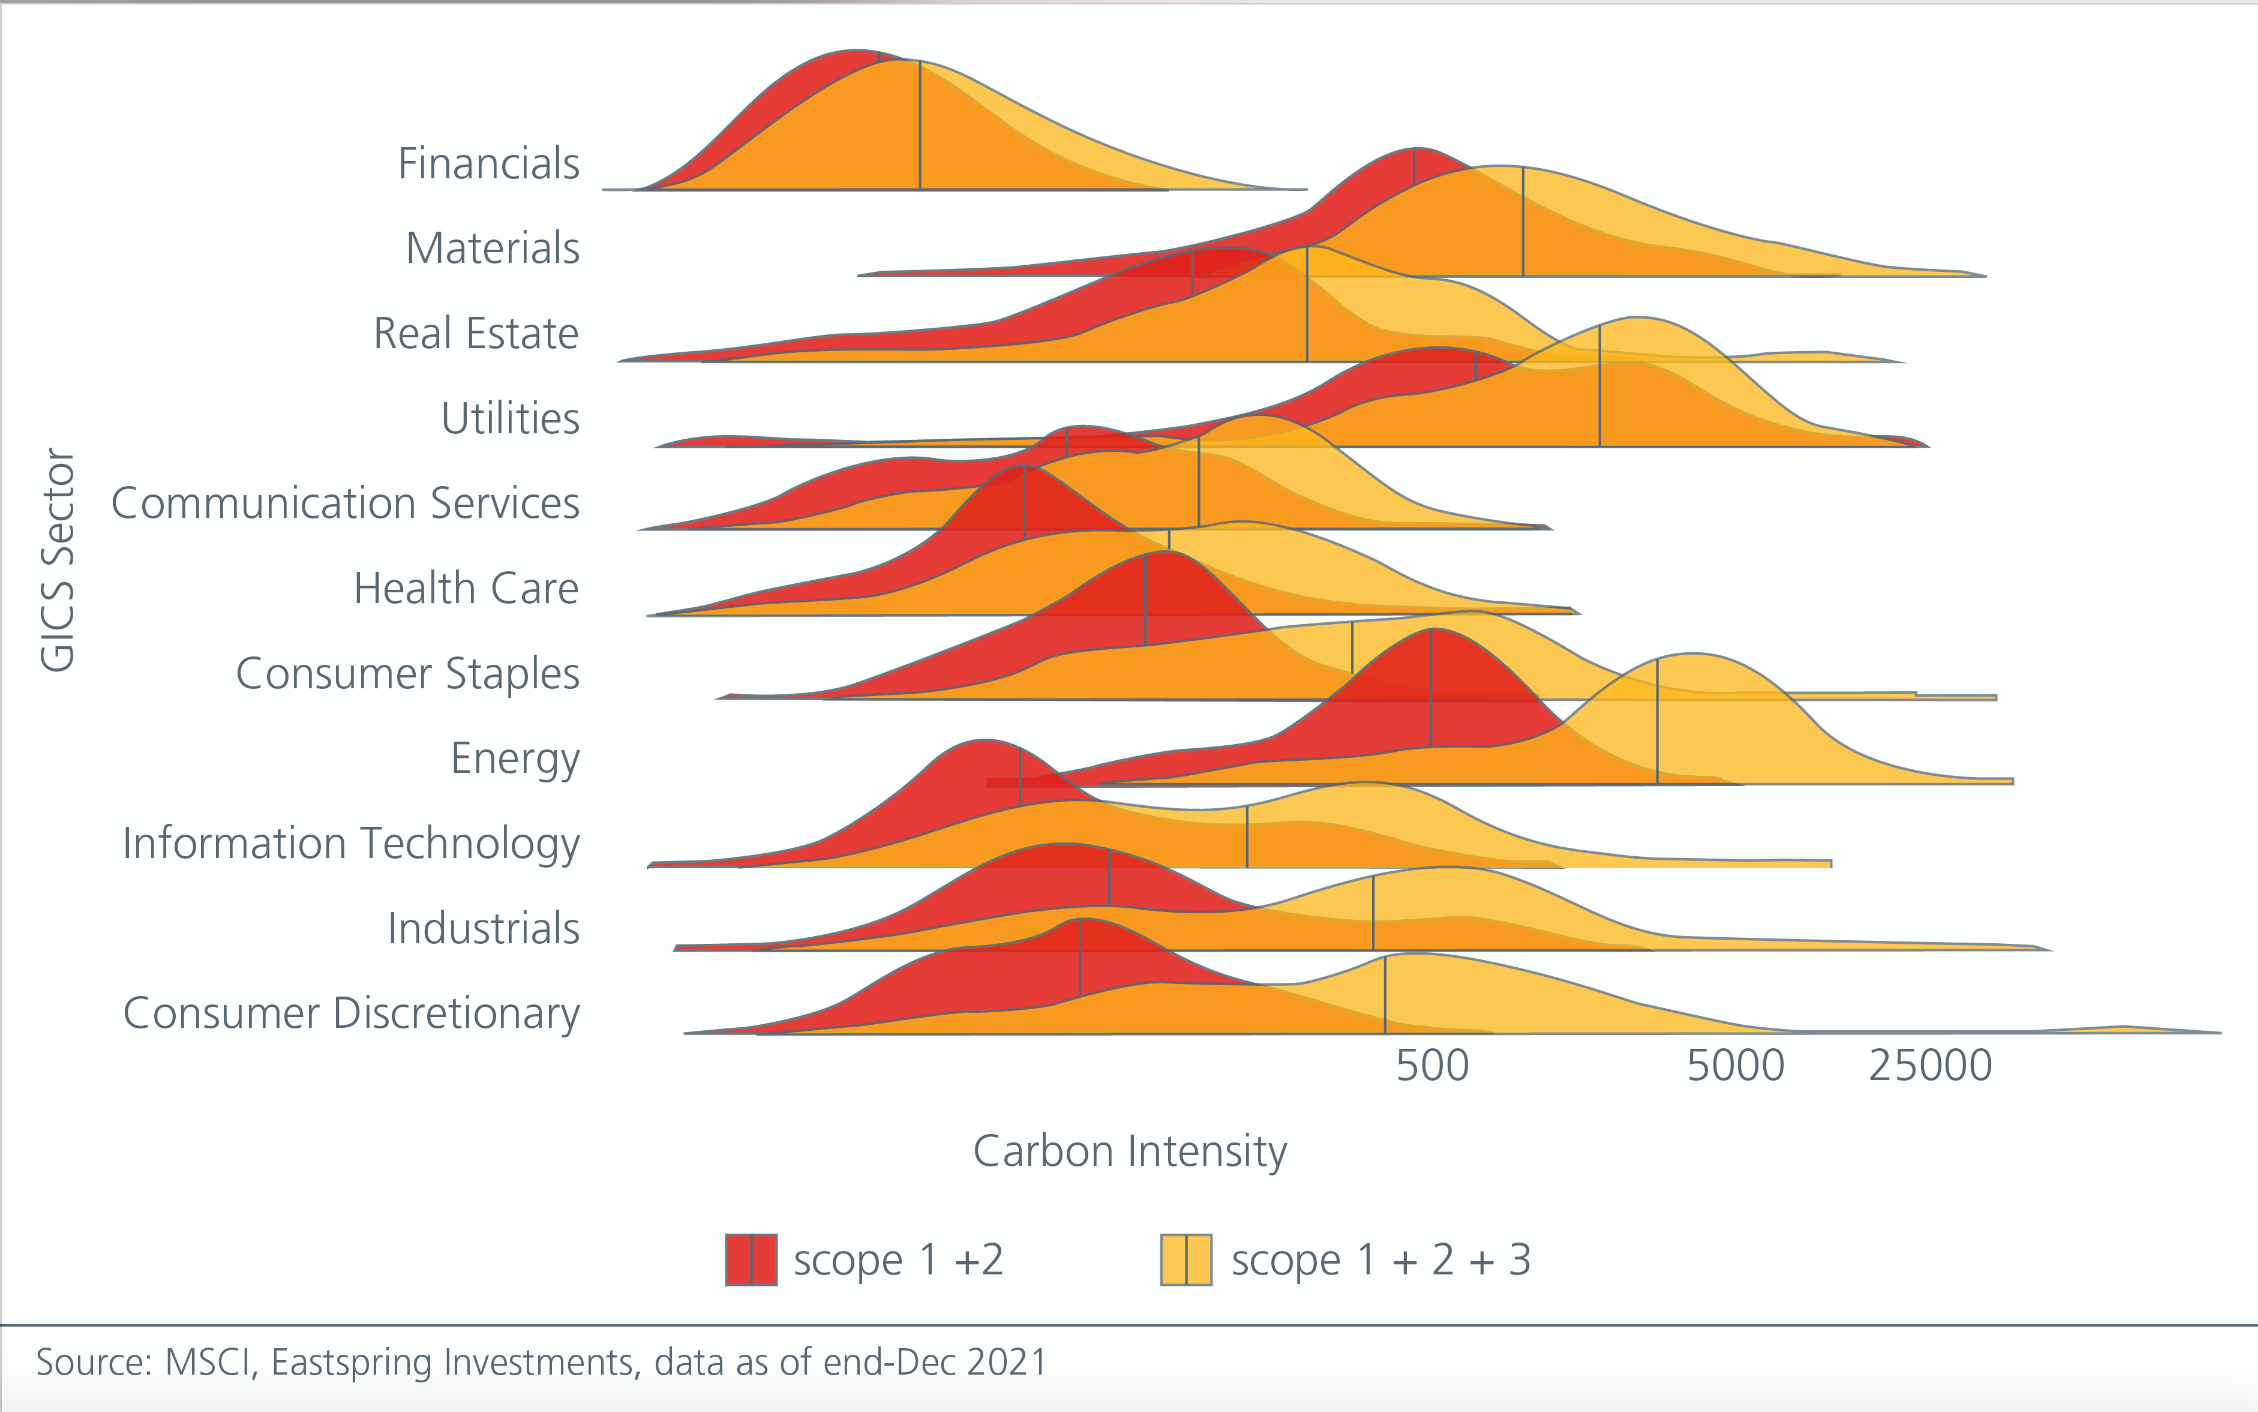
To examine this point, we look at the distribution of carbon intensity (carbon emissions normalised by sales) by sector3, ranked by the change in median after including Scope 3. In line with the observation above, Consumer Discretionary names saw the biggest increase in median intensity and there are also more outliers. See Fig 2.
While the Energy, Utilities and Materials sectors remain the highest emitters whether we include Scope 3 or not, the shift in median for Materials and Utilities ranked among the lowest among all sectors, whereas the Energy sector saw a relatively big increase in total emissions.
Fig. 2. Distribution of carbon intensity by sector (ranked by change in median)
Self-reported or estimated data?
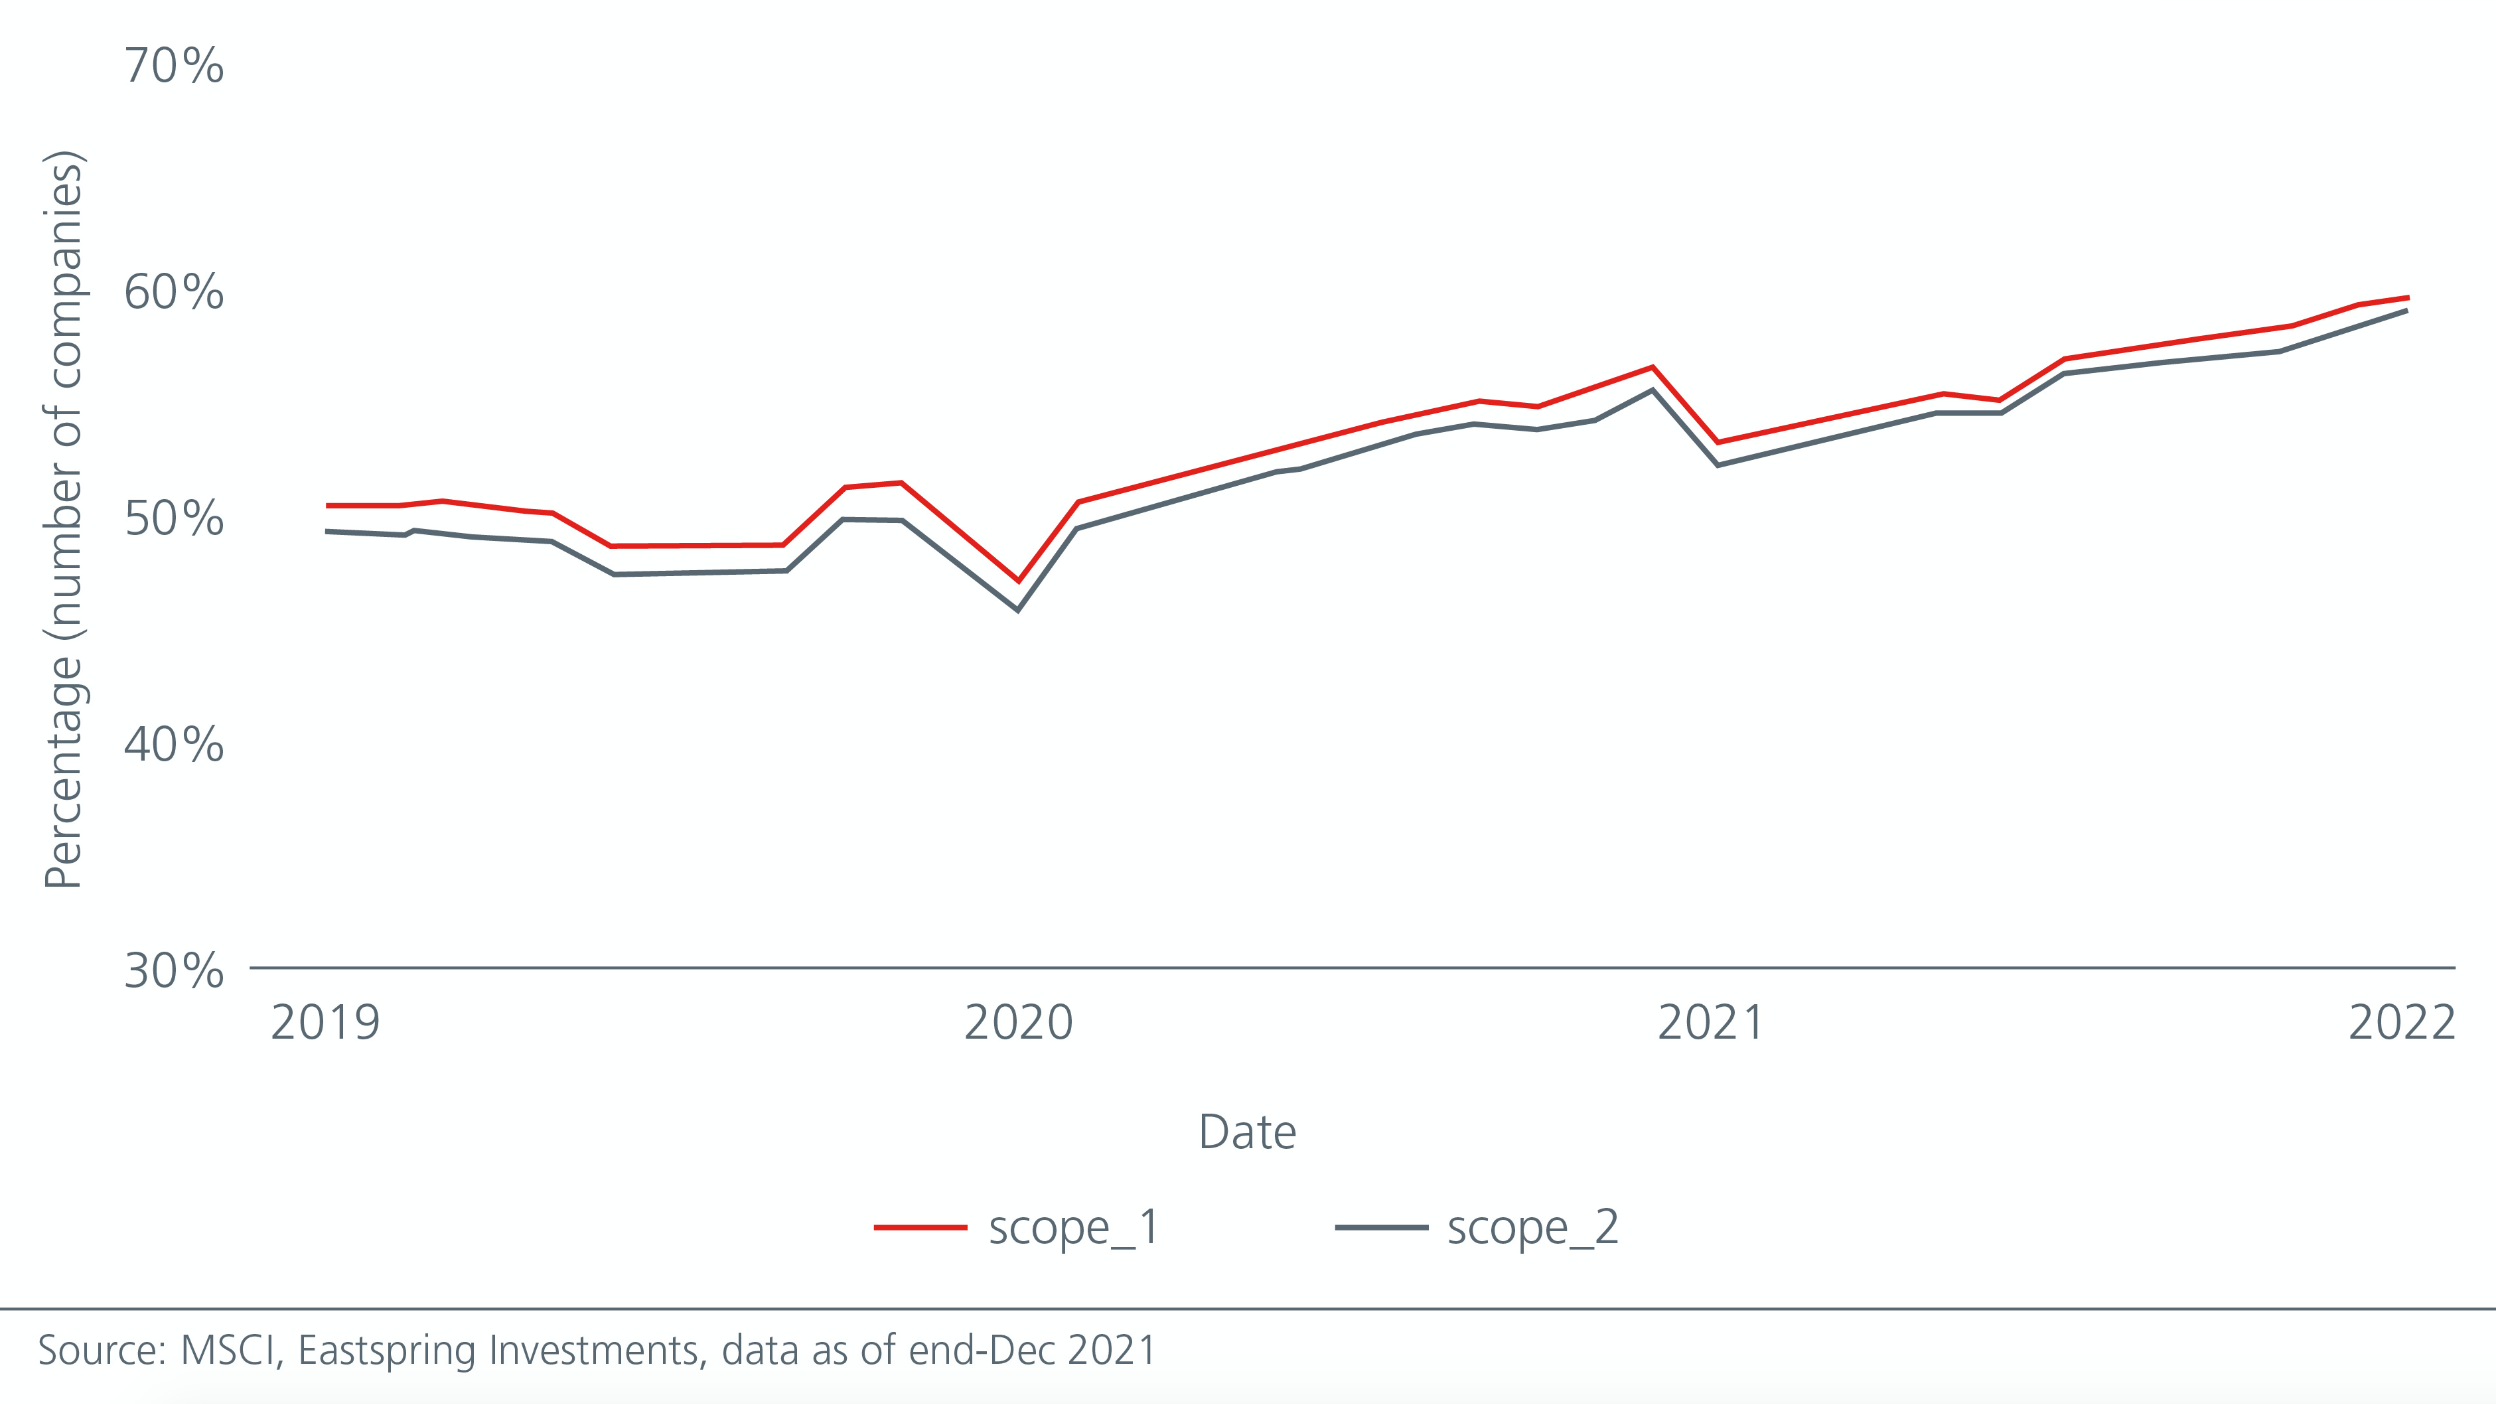
Another dimension for consideration when using available carbon emissions data is whether these metrics are self-reported by the company or estimated by a third party. In most cases, self-reported data is likely to be more reliable. Within the MSCI AC World index, only about half of the companies were reporting their emissions from Scopes 1 and 2 in January 2019. See Fig 3. However, that number has been on the rise, suggesting increasing awareness by both corporates and investors.
Fig 3: Companies that self-report carbon emissions
Based on a blog post by MSCI4, only 18% of the constituents of the MSCI ACWI IMI reported Scope 3 emissions as of March 2020. This suggests that reported data remains sparse for Scope 3.
Estimation models - are they reliable?
Given that many companies do not yet report carbon emissions data, especially when it comes to Scope 3, data providers turn to estimation models to complete a company’s carbon footprint profile.
According to the GHG Protocol technical guidance document5, one widely used model is the environmentally-extended input output (EEIO) model, which estimates energy usage and greenhouse gas emissions based on the production and upstream supply chain activities for a certain industry or product category.
The output of this model is typically emissions per unit of revenue in a particular industry. Using an example cited by the GHG Protocol, the model may estimate that the paper mills industry emits 1,520 tonnes of Co2e per $1 million in revenue. We could then estimate emissions based on a company’s revenue breakdown.
One advantage of the EEIO model is that once we have the estimation model for each business activity or industry, we could measure the emissions for the entire economy. A major drawback is that it assumes companies operating in the same industry produce the same emissions. However, we know some companies are more efficient than others. The trade-off here is between coverage and specificity.
Equally, there may also be the issue of double counting to round off the discussion on carbon emissions data. When we examine a portfolio’s overall carbon footprint, counting the Scope 3 emissions incurred by a company, whose output is also likely to be used for another company’s input, may overstate overall carbon emissions.
This can be further complicated by companies that have vast networks of suppliers and clients: where does the counting start and where does it end in the spiderweb of global supply chains? With only emissions from Scopes 1 and 2, this may be less of an issue as they only measure direct impact and electricity purchased instead of looking at the whole supply and value chain.
But over time, third-party estimation models could become more sophisticated. This should improve the overall data coverage and quality. As that precision improves, we may also see a shift in some companies’ overall carbon profile.
A quant approach offers clarity
Our role as quantitative investors is to help clients achieve low-carbon portfolios and shed some light on the underlying data. As we have seen above, one could be understating total emissions by excluding Scope 3. It is thus helpful to state upfront which emission scopes are incorporated in a carbon reduction target. If a strategy only aims to reduce emissions from Scopes 1 and 2, it may not be able to achieve the intended reduction when Scope 3 is also being considered.
If investors would like to include Scope 3, they should also be aware that the data coverage on Scope 3 remains sparse and there is also a higher risk of double counting due to the complexity of a company’s supply and value chain. One way to mitigate this is to incorporate a buffer around carbon targets to account for this imprecision. For instance, instead of setting a hard target of a 50 percent reduction of carbon intensity, perhaps a more sensible approach is to target a range (e.g., 40-60 percent reduction). Once investors are clear on the scopes and goals of their carbon reduction plan, there are several ways to achieve a low-carbon portfolio; one way would be through portfolio optimisation.
This article was originally published on Eastspring website.
Click here for more related insights from Eastspring.

' d='M0 0h300v57H0z'/%3e%3c/svg%3e "sgFsmLogoEnIcon")


'%3e%3cpath fill='%23fff' d='M0 0h21.6v21.6H0z'/%3e%3cg data-name='141-singapore'%3e%3cpath data-name='Rectangle 6502' fill='%23f0f0f0' d='M0 0h22v22H0z'/%3e%3cpath data-name='Rectangle 6503' fill='%23d80027' d='M0 0h22v10H0z'/%3e%3cg data-name='Group 21092' fill='%23f0f0f0'%3e%3cpath data-name='Path 14455' d='M2.917 5.365A3.128 3.128 0 015.374 2.31a3.128 3.128 0 100 6.11 3.128 3.128 0 01-2.457-3.055z'/%3e%3cpath data-name='Path 14456' d='M6.939 2.46l.222.683h.718l-.581.422.222.683-.581-.422-.581.422.222-.683-.581-.422h.718z'/%3e%3cpath data-name='Path 14457' d='M5.193 3.801l.222.683h.718l-.581.422.222.683-.581-.422-.581.422.222-.683-.581-.422h.718z'/%3e%3cpath data-name='Path 14458' d='M8.68 3.801l.222.683h.718l-.581.422.222.683-.581-.422-.581.422.222-.683-.581-.422h.718z'/%3e%3cpath data-name='Path 14459' d='M8.01 5.811l.222.683h.718l-.581.422.222.683-.581-.422-.581.422.222-.683-.581-.422h.718z'/%3e%3cpath data-name='Path 14460' d='M5.863 5.811l.222.683h.718l-.581.422.222.683-.581-.422-.581.422.222-.683-.581-.422h.718z'/%3e%3c/g%3e%3c/g%3e%3c/g%3e%3c/svg%3e "singaporeIcon")
' d='M0 0h67v14H0z'/%3e%3c/svg%3e "msFooterLogoIcon")
