


' fill='%23fff' stroke='%23707070' d='M0 0h21.6v21.6H0z'/%3e%3c/clipPath%3e%3cclipPath id='c'%3e%3cpath data-name='Rectangle 6531' transform='translate(-6319 -2048)' fill='%23fff' stroke='%23707070' d='M0 0h43.2v21.6H0z'/%3e%3c/clipPath%3e%3cclipPath id='a'%3e%3cpath d='M0 0h21.6v21.6H0z'/%3e%3c/clipPath%3e%3c/defs%3e%3cg data-name='Malaysia -Square' clip-path='url(%23a)'%3e%3cpath fill='%23fff' d='M0 0h21.6v21.6H0z'/%3e%3cg data-name='Mask Group 325' transform='translate(6348 2048)' clip-path='url(%23b)'%3e%3cg data-name='Mask Group 324' transform='translate(-35)' clip-path='url(%23c)'%3e%3cg data-name='Group 21195'%3e%3cpath data-name='Path 14718' d='M-6319-2048h43.2v21.6h-43.2z' fill='%23fff'/%3e%3cpath data-name='Path 14719' d='M-6317.457-2047.229h41.657m0 3.086h-41.657m0 3.086h41.657m0 3.086h-41.657' fill='none' stroke='%23c00' stroke-width='1.543'/%3e%3cpath data-name='Path 14720' d='M-6319-2048h21.6v13.114h-21.6z' fill='%23006'/%3e%3cpath data-name='Path 14721' d='M-6319-2034.886h43.2m0 3.086h-43.2m0 3.086h43.2' fill='none' stroke='%23c00' stroke-width='1.543'/%3e%3c/g%3e%3cpath data-name='Path 14722' d='M-6302.5-2045.686l.344 2.353 1.331-1.967-.714 2.269 2.054-1.2-1.626 1.731 2.372-.19-2.218.858 2.218.858-2.372-.19 1.626 1.736-2.054-1.2.714 2.269-1.331-1.97-.344 2.358-.344-2.353-1.331 1.97.714-2.269-2.054 1.2 1.626-1.737-2.372.19 2.218-.858-2.218-.859 2.372.19-1.626-1.736 2.054 1.2-.714-2.267 1.331 1.97zm-1.929.1a4.114 4.114 0 100 7.521 4.629 4.629 0 110-7.521z' fill='%23fc0'/%3e%3c/g%3e%3c/g%3e%3c/g%3e%3c/svg%3e "malaysiaIcon")
'%3e%3cpath fill='%23fff' d='M0 0h21.6v21.6H0z'/%3e%3cg data-name='067-hong-kong'%3e%3cpath data-name='Rectangle 6488' fill='%23d80027' d='M0 0h22v22H0z'/%3e%3cg data-name='Group 21086' fill='%23f0f0f0'%3e%3cpath data-name='Path 14432' d='M11.911 8.264c-.248 1.032-.689.835-.905 1.735a2.373 2.373 0 011.109-4.614c-.429 1.803.018 1.956-.204 2.879z'/%3e%3cpath data-name='Path 14433' d='M8.606 9.029c.9.555.581.913 1.37 1.4a2.373 2.373 0 01-4.045-2.481c1.577.964 1.866.586 2.675 1.081z'/%3e%3cpath data-name='Path 14434' d='M8.311 12.409c.807-.689 1.048-.271 1.752-.871a2.373 2.373 0 11-3.609 3.081c1.408-1.202 1.136-1.594 1.857-2.21z'/%3e%3cpath data-name='Path 14435' d='M11.435 13.734c-.406-.98.066-1.08-.287-1.935a2.373 2.373 0 111.815 4.385c-.708-1.71-1.165-1.573-1.528-2.45z'/%3e%3cpath data-name='Path 14436' d='M13.66 11.173c-1.058.083-1.007-.4-1.929-.325a2.373 2.373 0 114.731-.371c-1.846.145-1.856.621-2.802.696z'/%3e%3c/g%3e%3c/g%3e%3c/g%3e%3c/svg%3e "hongKongIcon")


How did FSM Indices (Equities & Bonds) perform in January?
Figure 1: FSM Indices Performance in January
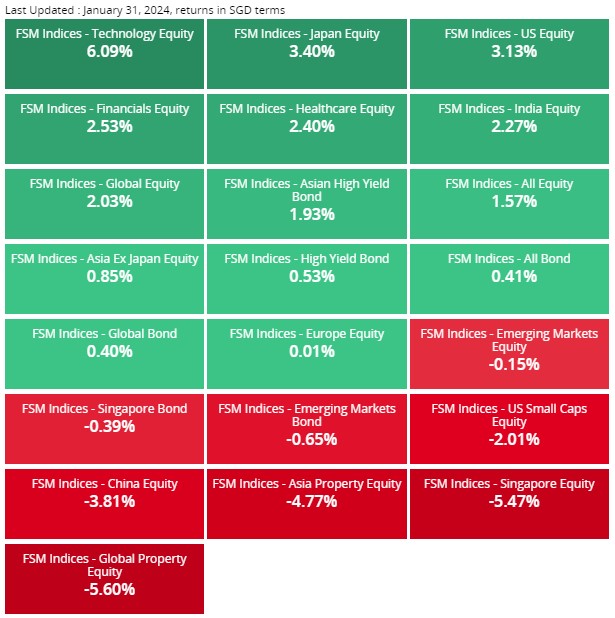
FSM Indices – Technology Equity was the best performer for the month, returning positive returns of +6.09%. With artificial intelligence (AI) remaining at the forefront of investors’ minds as a catalyst for growth, global technology stocks have continued to power higher, led by the Big Tech stocks. Meanwhile, semiconductor companies like Nvidia and Advanced Micro Devices, which are beneficiaries of this AI gold rush, have risen by more than 20% (in USD terms) in January.
FSM Indices – Japan Equity was another strong performer, generating positive returns of +3.40% in January. There are several catalysts for Japanese equities, from Japan’s economic recovery as a nation, to corporate governance reforms that will improve profit margins and shareholder value. Furthermore, Japan is finally exiting from a regime of deflation to inflation, driven by wage growth, which could result in a change in behaviour exhibited by households and corporates. With a change in mindset, there will be changes in consumption, investment, and savings patterns that will have significant positive ramifications for the equity market and the broader economy over the long term.
FSM Indices – Global Property Equity was the worst performer for the month, declining by -5.60%. The real estate sector is particularly sensitive to interest rates. As the markets cut back on their rate cut bets, this has affected investor sentiments, especially when these properties need to refinanced at higher rates in the future. China’s real estate market who was once a huge driver of the country’s economic growth, continues to remain in the doldrums. Evergrande, one of the largest property giants in China, has been ordered to liquidate after it was unable to provide a concrete restructuring plan despite several court hearings and failed negotiations with offshore creditors. This liquidation process is expected to be a long and drawn-out process, once again highlighting that the real estate problem in China would not be resolved anytime soon.
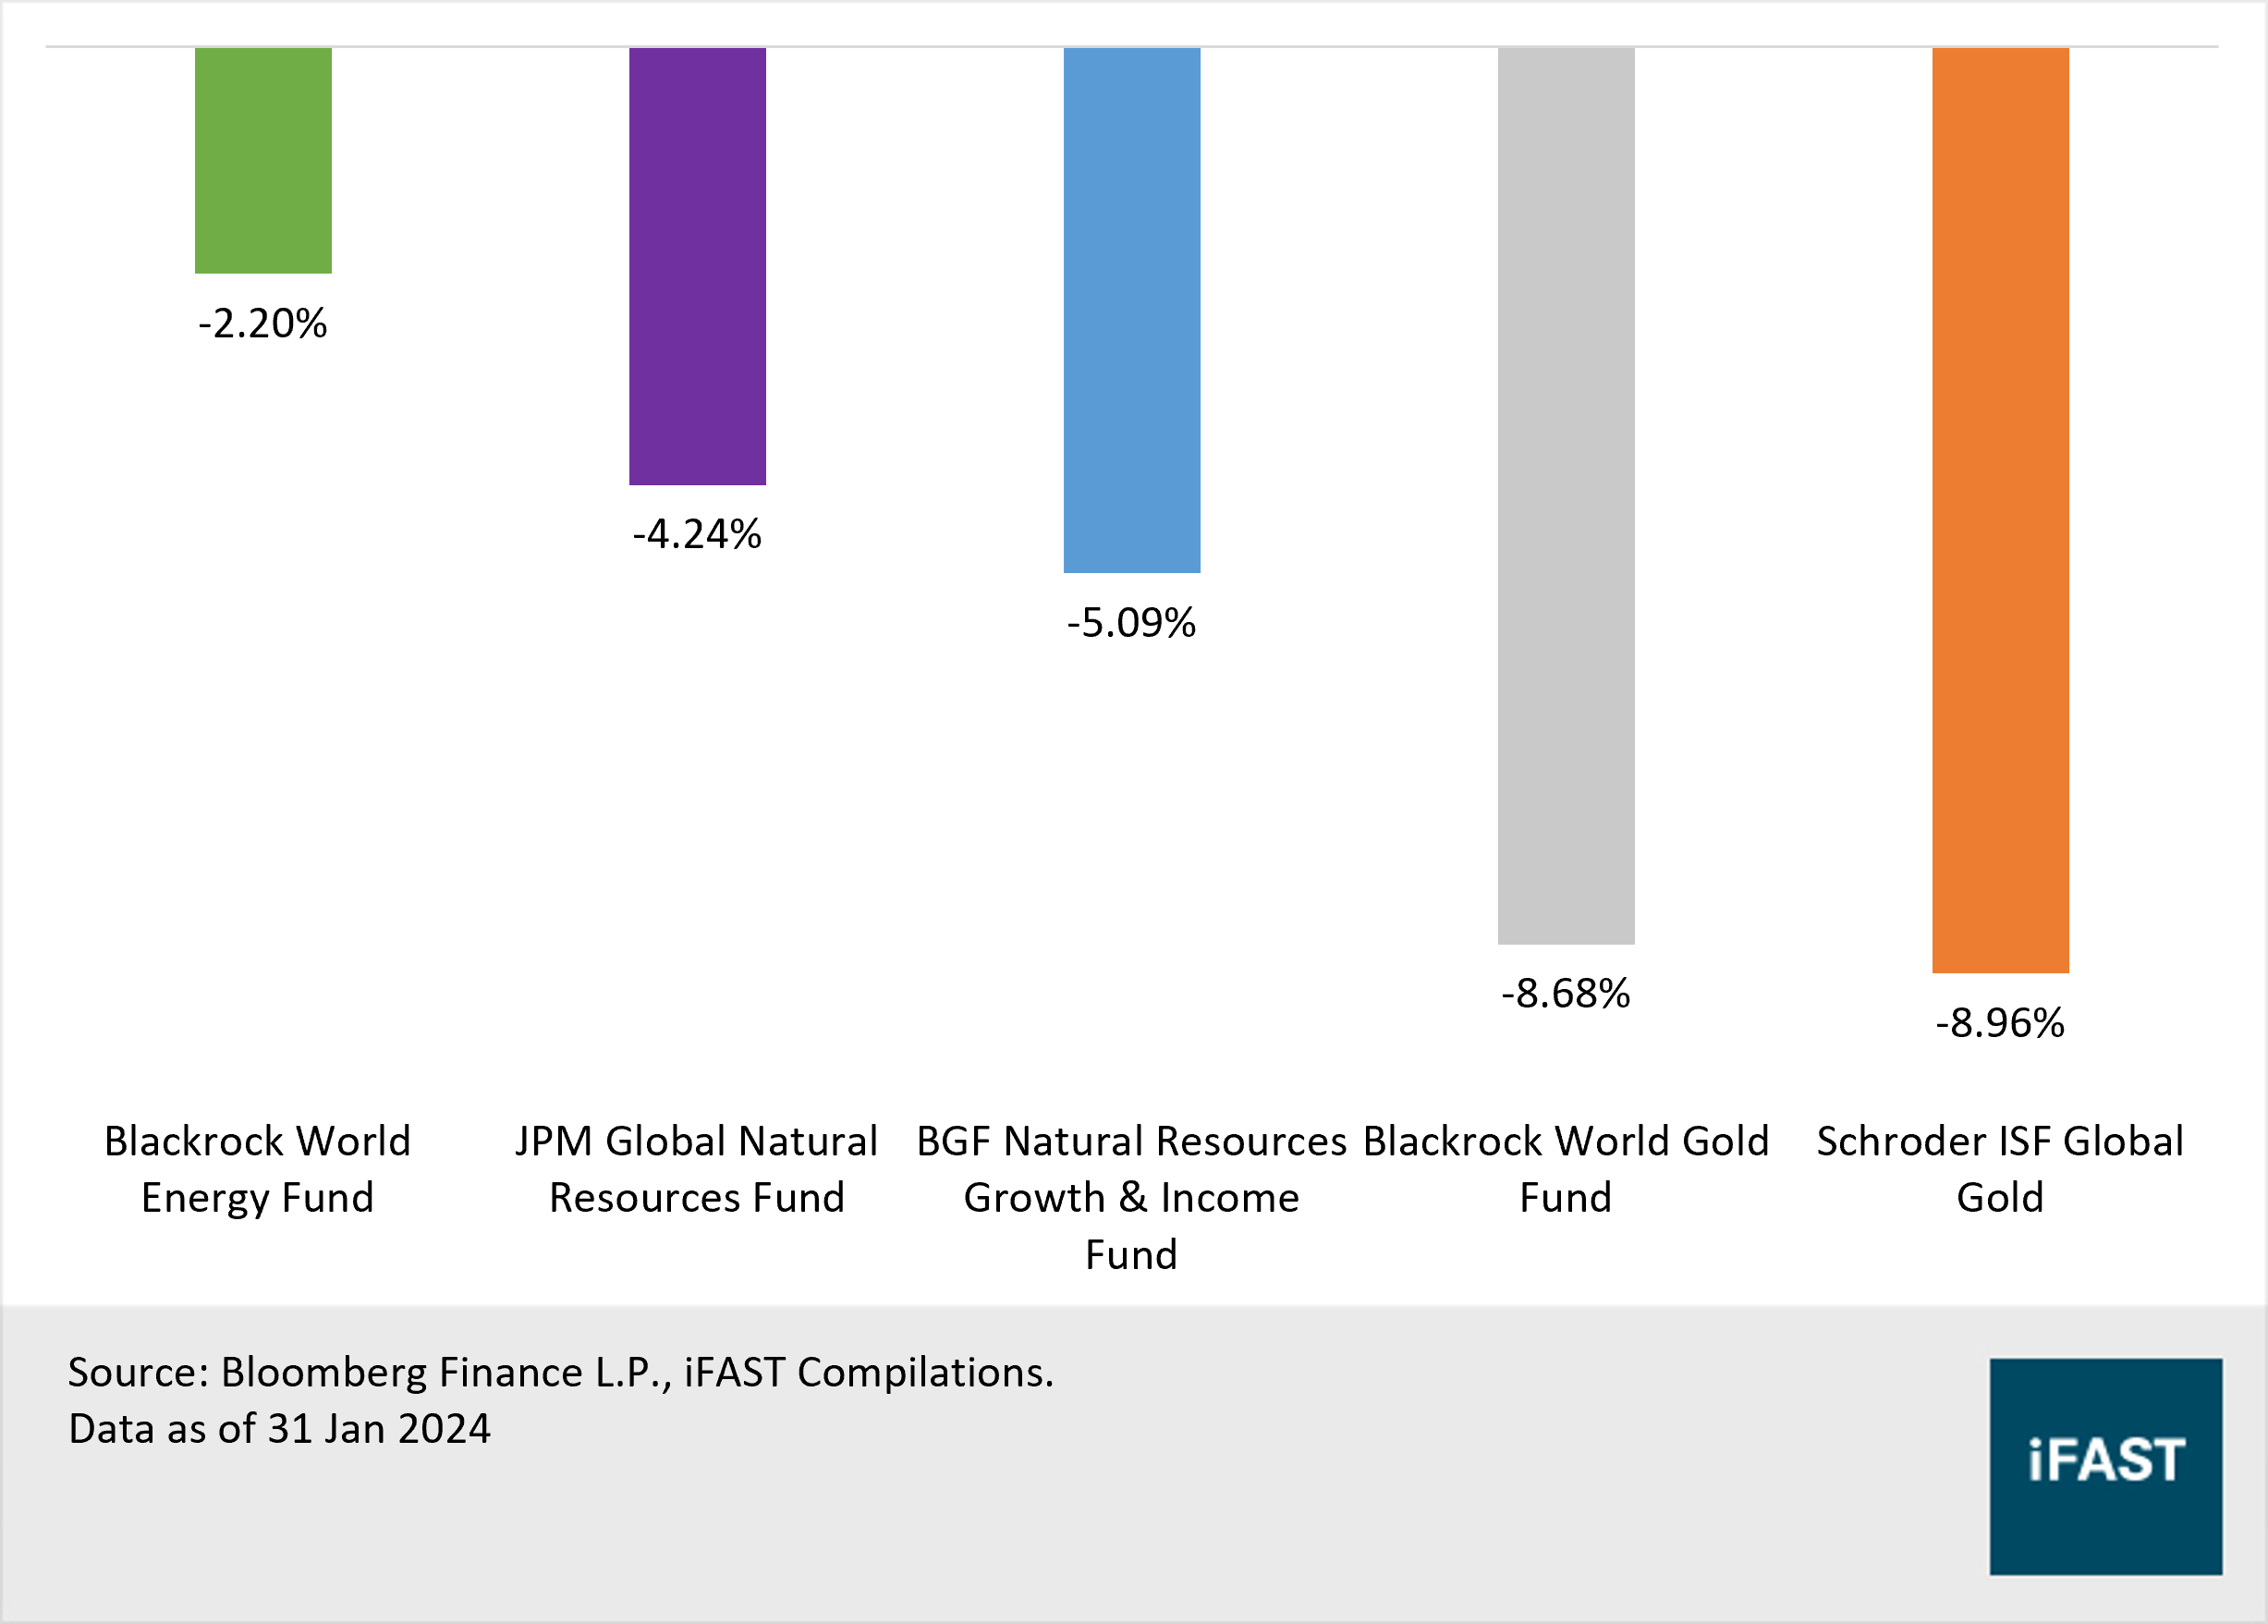
Looking at commodity and energy funds, they delivered poor results across the board in January (Figure 2). Energy-related funds outperformed gold-related funds, as oil prices rose due to upward revisions in global economic growth forecast while escalating tensions in the Middle East helped to offset concerns around Chinese demand. Meanwhile, high Treasury yields continue to make holding zero-yield bullion less attractive.
Figure 2: Returns of Commodity and Energy Funds in January
Here are some noteworthy funds we’ll like you to check out
Q&A Series: Embracing longevity and success with Capital Group’s flagship fund
In our UT Q&A Series, we featured the Capital Group New Perspective Fund (LUX), a global equity flagship fund that was designed to thrive on long-term investment opportunities, arising from changing patterns of global trade and changing economic and political relationships.
Although the fund was only launched in 2015, the New Perspective strategy was first launched in 1973 and has been around for more than 50 years, which is a testament to the longevity of its investment approach.
After a series of changes made over the years, the portfolio of the fund has become more balanced by geography, sector and style, with nearly 50% of the portfolio invested in companies based outside of the US.
In 2023, although equity markets were narrowly driven by a handful of large technology companies in the US, the fund has continued to perform well despite a relatively lower exposure to the Magnificent 7 (Alphabet, Amazon, Apple, Meta Platforms, Microsoft, NVIDIA and Tesla), highlighting the strong research and stock selection capabilities of the team.
The fund’s long-term focus on investing in multinational companies has resulted in superior outcomes for investors over full market cycles. Over the last 50 years, the strategy has returned 11.0% per annum (p.a.) vs 8.4% p.a. for the benchmark MSCI AC World Index, while Capital Group New Perspective Fund (LUX) has returned 8.9% p.a. vs 8.7% p.a. for the index since its inception in Oct 2015.
Related article - Q&A Series: Embracing longevity and success with Capital Group’s flagship fund
Q&A Series: Invest in world-class equities with BNY Mellon’s long-term strategy
In our UT Q&A Series, we also shined the spotlight on BNY Mellon’s Long Term Global Equity Fund, a global equity fund that is intended to generate sustained capital appreciation over a long-term horizon.
The management of this funds falls under Walter Scott, which acts as the sub-advisor to the BNY Mellon Long Term Global Equity Fund. Since the firm was founded in 1983, stock-specific investment research has been at the heart of its investment philosophy and process. Walter Scott believes that, over time, the returns derived from investing in the shares of a company will reflect the internal wealth generated by that business. By investing in companies believed to be capable of sustaining exceptional rates of internal wealth creation over the long term, superior investment returns can be achieved.
With a bottom-up investment approach, the fund consists of a concentrated portfolio of 40-60 stocks, which are selected on the basis of their long-term fundamentals rather than on any thematic, geographical, or sector view.
While the fund tends to differ starkly from commonly referenced benchmark indices, it has outperformed its benchmark MSCI World Index over the long term. Since inception (7 April 2008) to 30 November 2023, the Fund’s performance is 7.1% p.a. (class C USD, net of 1% management fee) vs. 6.7% p.a. for the benchmark, MSCI World (net dividend return). The maximum drawdown was during the 2008 financial crisis, from May 2008 to 28 February 2009, with the Fund returning -38.9% (net) vs. -50.0% for the benchmark. The Fund recovered after 24 months which was notably quicker than the benchmark, which took 47 months to recover.
Related article - Q&A Series: Invest in world-class equities with BNY Mellon’s long-term strategy
Finally, our top fund pick for the month!
Our top fund pick for the month of September is the Fullerton SGD Cash Fund! This is also our recommendation in the “Money Market” Category.
The fund aims to provide investors with liquidity and a return that is comparable to that of the Singapore Dollar Banks Saving Deposits rate. It invests primarily in SGD deposits with eligible financial institutions as defined by the MAS, with maturities not more than 366 calendar days (i.e. 1 year); however, it may also invest up to 10% of fund NAV into deposits with maturities between 1 and 2 years.
Based on the latest available data (e.g. factsheets), its top counterparties (for bank deposits) are a mix of foreign banks originating from different countries. Together, its top 5 counterparties account for over 60% of the fund’s NAV, including two G-SIBs based in Japan (Sumitomo Mitsui and MUFG). While this may seem concentrated at first glance, we do not find this concerning given (i) the high quality of bank names involved; and (ii) the limited universe of appropriate counterparties.
In terms of maturities, a large majority of its deposits (83.7%) have less than (or equal to) 4 weeks to maturity. The fund has also indicated that its weighted average maturity (WAM) was about 39 days as of 29 Dec 2023. Given this, we expect the fund’s ‘duration’ to be around one month, making it one of the shortest-duration funds on our platform.
In terms of yields, the fund has indicated that its gross indicative yield (as of 29 Dec 2023) was 3.98%, with a 5-day rolling average of 4.03%. Subtracting this gross yield by an expense ratio of 0.15% should give a net indicative yield of 3.83% (5-day rolling average of 3.88%), representing a fairly attractive yield considering the low risks involved.
The fund has delivered solid returns over the years, with a 5-year annualised return of 1.7% (as of 31 Dec 2023). In the past year, returns have been further enhanced by the higher-rates environment, allowing the fund to deliver an annualised return of 3.9% in 2023. With the prospect for higher-for-longer rates (especially for shorter-end policy rates), we expect the fund to continue delivering solid returns.
Final Thoughts
The US economy continues to remain resilient, powered by the strength of US consumers and a robust labour market. While inflation has been slowly trending down, financial markets may be too optimistic about how soon and how fast the Fed will ease policy through interest rate cuts this year. At the recent January Federal Open Market Committee (FOMC) meeting, Fed Chairman Jerome Powell even signalled that a rate cut in March is unlikely, and will adopt a wait and see approach to prevent a policy misstep that could ignite inflation.
We believe that the Fed will not cut rates this year. Even if the Fed does cut rates this year, it is unlikely to be as aggressive as what investors are pricing in at this moment. In an environment where interest rates will remain higher for longer, we continue to hold a preference towards short duration bonds for fixed income.
As for equities, we favour the digital economy and semiconductor sectors in the US. While share prices have been rallying in the past few months, fundamentals have not declined but rather improved, with Big Tech and semiconductor companies demonstrating strong growth in the recent earnings.
Last but not least, within Asia, investors can look to our new Asian Tigers – Japan, South Korea, and Singapore, which stand to benefit from shifting geopolitics, domestic catalysts and the resurgence of the semiconductor industry.
Related articles:
iFAST 2024 Investment Outlook: Your must-read guide to navigating markets in 2024 and beyond
The Fed will not cut rates this year. Here’s why.
Declaration:
For specific disclosure, at the time of publication of this report, IFPL (via its connected and associated entities) and the analyst who produced this report hold a NIL position in the abovementioned securities.

' d='M0 0h300v57H0z'/%3e%3c/svg%3e "sgFsmLogoEnIcon")


'%3e%3cpath fill='%23fff' d='M0 0h21.6v21.6H0z'/%3e%3cg data-name='141-singapore'%3e%3cpath data-name='Rectangle 6502' fill='%23f0f0f0' d='M0 0h22v22H0z'/%3e%3cpath data-name='Rectangle 6503' fill='%23d80027' d='M0 0h22v10H0z'/%3e%3cg data-name='Group 21092' fill='%23f0f0f0'%3e%3cpath data-name='Path 14455' d='M2.917 5.365A3.128 3.128 0 015.374 2.31a3.128 3.128 0 100 6.11 3.128 3.128 0 01-2.457-3.055z'/%3e%3cpath data-name='Path 14456' d='M6.939 2.46l.222.683h.718l-.581.422.222.683-.581-.422-.581.422.222-.683-.581-.422h.718z'/%3e%3cpath data-name='Path 14457' d='M5.193 3.801l.222.683h.718l-.581.422.222.683-.581-.422-.581.422.222-.683-.581-.422h.718z'/%3e%3cpath data-name='Path 14458' d='M8.68 3.801l.222.683h.718l-.581.422.222.683-.581-.422-.581.422.222-.683-.581-.422h.718z'/%3e%3cpath data-name='Path 14459' d='M8.01 5.811l.222.683h.718l-.581.422.222.683-.581-.422-.581.422.222-.683-.581-.422h.718z'/%3e%3cpath data-name='Path 14460' d='M5.863 5.811l.222.683h.718l-.581.422.222.683-.581-.422-.581.422.222-.683-.581-.422h.718z'/%3e%3c/g%3e%3c/g%3e%3c/g%3e%3c/svg%3e "singaporeIcon")


' d='M0 0h67v14H0z'/%3e%3c/svg%3e "msFooterLogoIcon")
