


' fill='%23fff' stroke='%23707070' d='M0 0h21.6v21.6H0z'/%3e%3c/clipPath%3e%3cclipPath id='c'%3e%3cpath data-name='Rectangle 6531' transform='translate(-6319 -2048)' fill='%23fff' stroke='%23707070' d='M0 0h43.2v21.6H0z'/%3e%3c/clipPath%3e%3cclipPath id='a'%3e%3cpath d='M0 0h21.6v21.6H0z'/%3e%3c/clipPath%3e%3c/defs%3e%3cg data-name='Malaysia -Square' clip-path='url(%23a)'%3e%3cpath fill='%23fff' d='M0 0h21.6v21.6H0z'/%3e%3cg data-name='Mask Group 325' transform='translate(6348 2048)' clip-path='url(%23b)'%3e%3cg data-name='Mask Group 324' transform='translate(-35)' clip-path='url(%23c)'%3e%3cg data-name='Group 21195'%3e%3cpath data-name='Path 14718' d='M-6319-2048h43.2v21.6h-43.2z' fill='%23fff'/%3e%3cpath data-name='Path 14719' d='M-6317.457-2047.229h41.657m0 3.086h-41.657m0 3.086h41.657m0 3.086h-41.657' fill='none' stroke='%23c00' stroke-width='1.543'/%3e%3cpath data-name='Path 14720' d='M-6319-2048h21.6v13.114h-21.6z' fill='%23006'/%3e%3cpath data-name='Path 14721' d='M-6319-2034.886h43.2m0 3.086h-43.2m0 3.086h43.2' fill='none' stroke='%23c00' stroke-width='1.543'/%3e%3c/g%3e%3cpath data-name='Path 14722' d='M-6302.5-2045.686l.344 2.353 1.331-1.967-.714 2.269 2.054-1.2-1.626 1.731 2.372-.19-2.218.858 2.218.858-2.372-.19 1.626 1.736-2.054-1.2.714 2.269-1.331-1.97-.344 2.358-.344-2.353-1.331 1.97.714-2.269-2.054 1.2 1.626-1.737-2.372.19 2.218-.858-2.218-.859 2.372.19-1.626-1.736 2.054 1.2-.714-2.267 1.331 1.97zm-1.929.1a4.114 4.114 0 100 7.521 4.629 4.629 0 110-7.521z' fill='%23fc0'/%3e%3c/g%3e%3c/g%3e%3c/g%3e%3c/svg%3e "malaysiaIcon")
'%3e%3cpath fill='%23fff' d='M0 0h21.6v21.6H0z'/%3e%3cg data-name='067-hong-kong'%3e%3cpath data-name='Rectangle 6488' fill='%23d80027' d='M0 0h22v22H0z'/%3e%3cg data-name='Group 21086' fill='%23f0f0f0'%3e%3cpath data-name='Path 14432' d='M11.911 8.264c-.248 1.032-.689.835-.905 1.735a2.373 2.373 0 011.109-4.614c-.429 1.803.018 1.956-.204 2.879z'/%3e%3cpath data-name='Path 14433' d='M8.606 9.029c.9.555.581.913 1.37 1.4a2.373 2.373 0 01-4.045-2.481c1.577.964 1.866.586 2.675 1.081z'/%3e%3cpath data-name='Path 14434' d='M8.311 12.409c.807-.689 1.048-.271 1.752-.871a2.373 2.373 0 11-3.609 3.081c1.408-1.202 1.136-1.594 1.857-2.21z'/%3e%3cpath data-name='Path 14435' d='M11.435 13.734c-.406-.98.066-1.08-.287-1.935a2.373 2.373 0 111.815 4.385c-.708-1.71-1.165-1.573-1.528-2.45z'/%3e%3cpath data-name='Path 14436' d='M13.66 11.173c-1.058.083-1.007-.4-1.929-.325a2.373 2.373 0 114.731-.371c-1.846.145-1.856.621-2.802.696z'/%3e%3c/g%3e%3c/g%3e%3c/g%3e%3c/svg%3e "hongKongIcon")


- The S&P 500 index has rallied over 7% this year; interestingly, most of the performance has been led by mega-cap stocks.
- While mega-cap stocks have delivered impressive gains, the average return across other S&P 500 constituents have been closer to flat.
- Given the top-heavy performance within the index, value is starting to emerge in small and mid-cap (SMID) stocks.
- SMID stocks are currently trading at attractive valuations, with profitable small-cap names trading at a 26% discount to larger peers.
- Research shows that SMID-cap stocks tend to underperform large-cap stocks in the period leading to a recession.
- However, SMID-cap stocks tend to bounce back during the recovery phase, outperforming large-caps 83% of the time in recoveries and producing average annualised returns of 26% during the recovery phase.
- Thus, we think savvy investors can consider an allocation to SMID-cap stocks and position for a potential recovery.
- Instead of just investing in a traditional SMID-cap index, we think a “smarter” approach is to apply a moat investing philosophy on SMID-cap stocks.
- Leveraging Morningstar’s rigorous equity research, investors can consider the VanEck Morningstar SMID Moat ETF (SMOT). The fund provides exposure to SMID-cap stocks, targeting companies with long-term competitive advantages and attractive valuations.
- Based on hypothetical data, the SMOT index has historically outperformed both broad SMID-cap and large-cap US equity markets.
SMID
stocks missing out on the rally
The S&P 500 index has been up more than 7% year-to-date. However, the rally has been far from broad-based. Majority of the performance can be attributed to the top 20 stocks, which hold a 29.17% weight in the index (Chart 1).
While these mega-cap stocks have delivered solid gains, the average return across other S&P 500 constituents has been closer to flat. US SMID-cap stocks have missed out on this rally.
Chart 1: Mega-cap stocks in the S&P 500 index contribute most of the rally
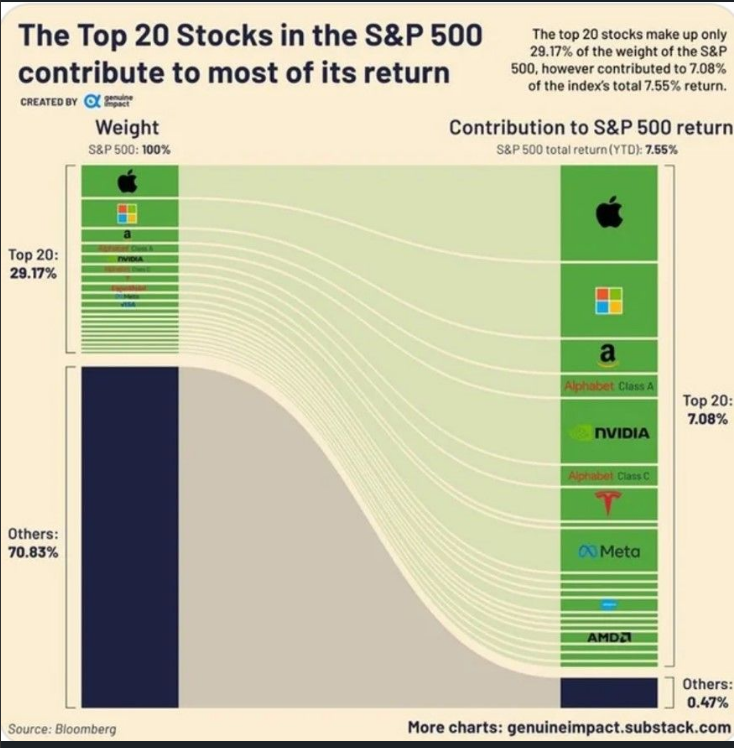
Source: Bloomberg, 31 May 2023
In the post-COVID era, SMID-cap stocks have underperformed large-caps. This has resulted in attractive valuations, with profitable small-cap names currently trading at a 26% discount to larger peers.
This combined with an economic recovery phase possibly on the horizon, where smaller-caps have historically outperformed, supports the case that now may be a good opportunity for investors to allocate to this space.
Below, we show how SMID-cap stocks tend to perform before and after past recessionary periods.
Performance
leading into a recession
Historically, SMID-cap stocks have shown a tendency to underperform large-cap stocks in the period leading to a recession. This is due to their higher risk profile and greater sensitivity to economic conditions. As uncertainty increases and economic indicators point toward a slowdown, investors often shift their portfolios towards more stable, large-cap companies, which are considered safer during turbulent times.
In Chart 2, SMID-cap stocks as represented by the Russell 2500 Index, have underperformed the S&P 500 index during the 12 months preceding recent recessions. On average, SMID-cap stocks underperformed by nearly 700 basis points during these periods.
While we are not officially in a recession today, smaller companies have been punished as if we are heading in that direction. As of end-May, SMID-cap stocks have underperformed the S&P 500 index by about 700 basis points over the last year.
Chart 2: SMID-cap stocks underperformance during past recessionary periods
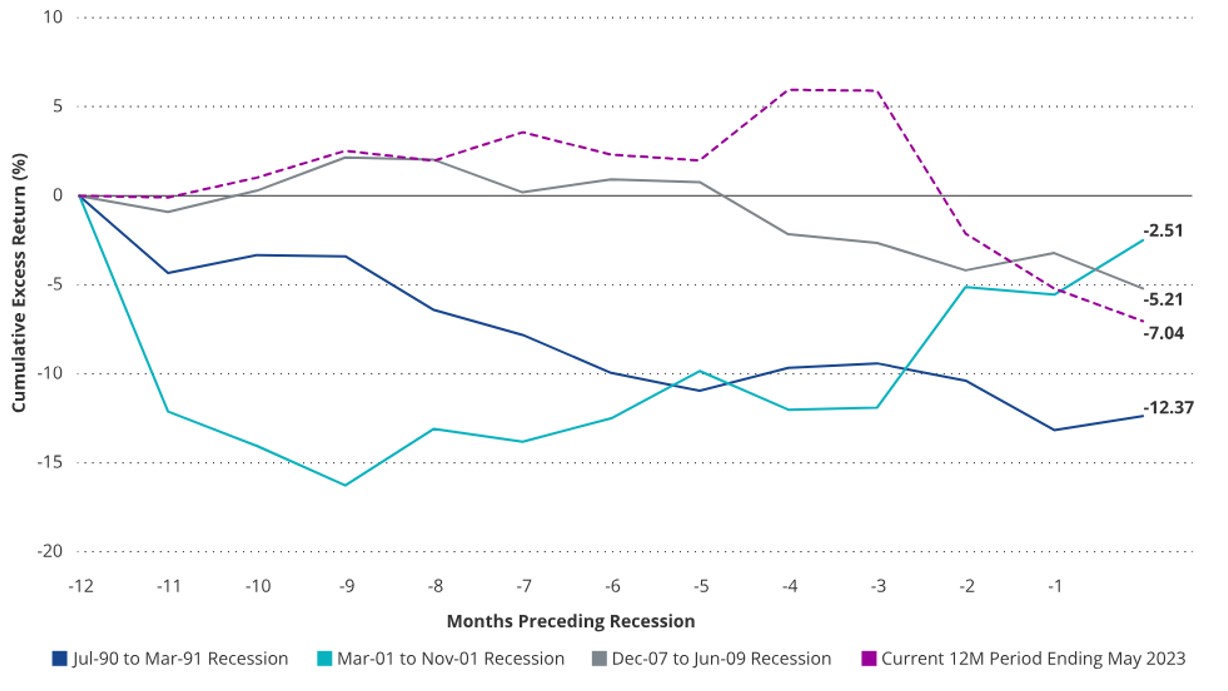
Source: Morningstar. SMID Cap Stocks represented by the Russell 2500 Index. Cumulative Excess performance relative to the S&P 500 Index. Past performance is no guarantee of future results.
Positive performance following a recession
While SMID-cap stocks often bear the brunt of a recession, they also tend to bounce back during the recovery phase. Historically, smaller companies have outperformed their larger counterparts 83% of the time in recoveries and saw average annualised returns of 26% during the recovery phase. This is because smaller companies tend to benefit more from fiscal stimulus measures and are more leveraged to the domestic economy, which usually recovers before the global economy. They are also more agile and can adapt quickly to changing economic conditions.
In Chart 3, SMID-cap stocks as represented by the Russell 2500 Index, outperformed the S&P 500 index by roughly 1000 basis points in the 12 months following the end of recent recessions. Furthermore, data shows that this outperformance extends beyond just the first year. Increasing to five-year post-recession periods, the average annualised return for smaller-cap companies was 14.5% compared to an annualised return of about 12% for large-caps.
Chart 3: SMID-cap excess return over S&P 500 index after past recessionary periods
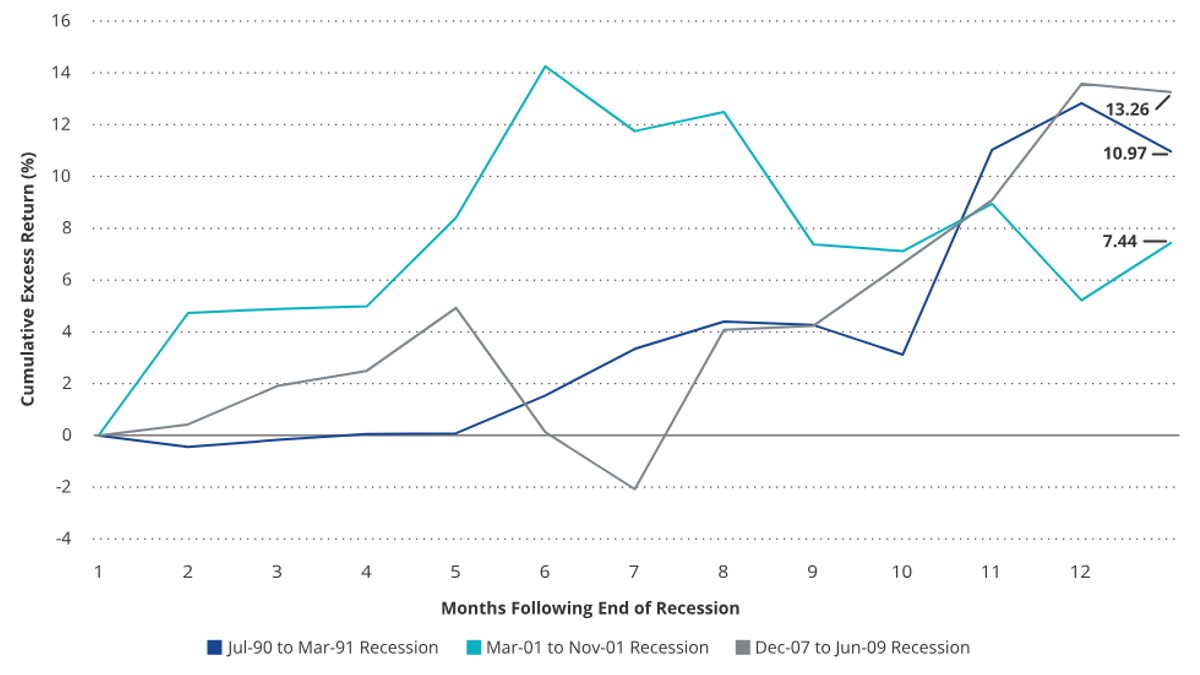
Source: Morningstar. SMID Cap Stocks represented by the Russell 2500 Index. Cumulative Excess performance relative to the S&P 500 Index. Past performance is no guarantee of future results.
SMID-cap stocks present a compelling valuation opportunity
Currently, valuations for SMID-cap companies are attractive relative to large-caps. As of end-April, the forward price-to-earnings (P/E) ratio for SMID-cap companies are now at 20-year lows relative to large-caps.
This relative undervaluation could provide a good entry point for investors considering an allocation to smaller cap companies. While the threat of an economic slowdown or recession is still present, the potential upside of these beaten down stocks in a recovery could be rewarding for patient investors.
Chart 4: SMID-cap forward P/E relative to large-cap forward P/E (January 2004-April 2023)
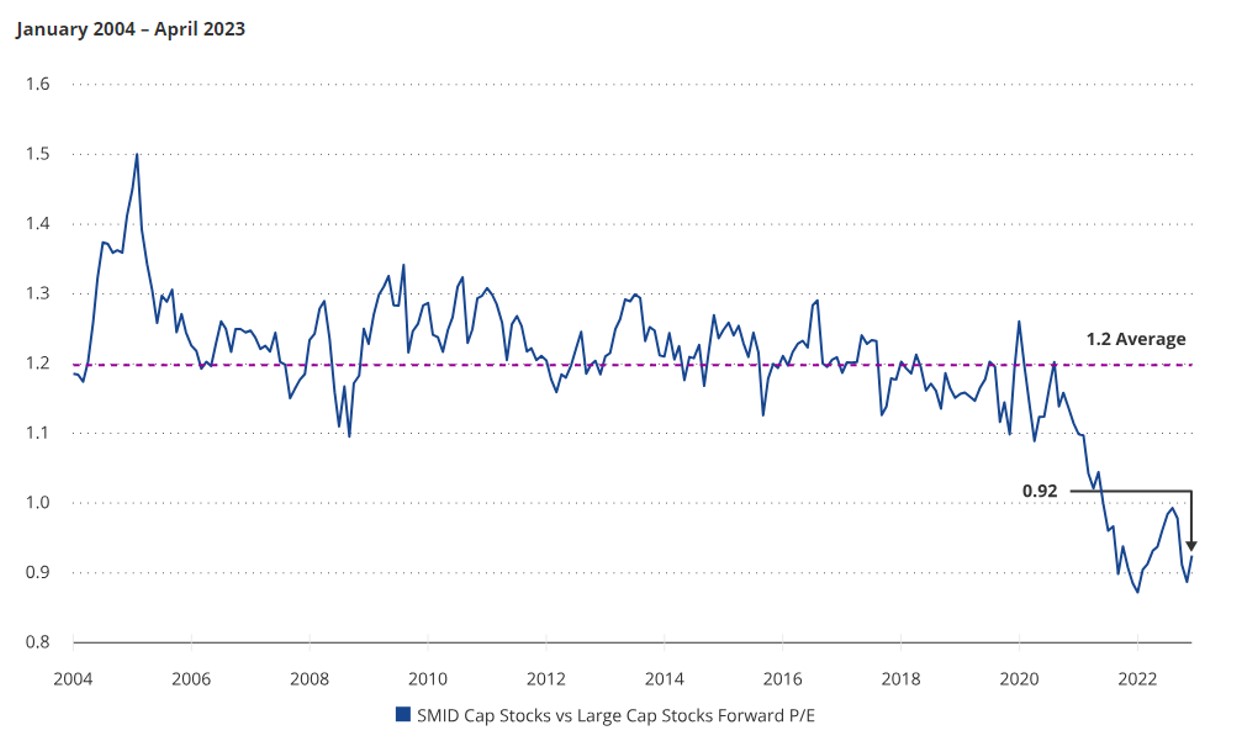
Source: Bloomberg. SMID Cap Stocks represented by the Russell 2500 Index. Large Cap Stocks represented by the S&P 500 Index. Past performance is no guarantee of future results.
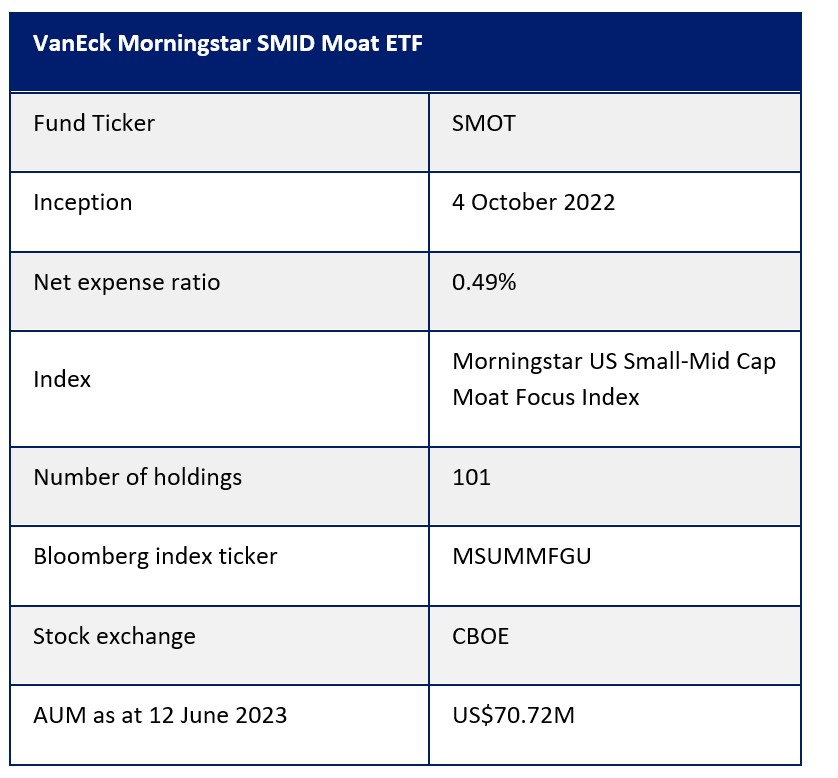
VanEck Morningstar SMID Moat ETF (SMOT)
Within this universe, a strategy that selectively identifies stocks may be more prudent than a broad-based market approach. Leveraging Morningstar’s rigorous equity research, the VanEck Morningstar SMID Moat ETF (SMOT) provides thoughtful exposure to SMID-cap stocks, targeting companies with long-term competitive advantages and attractive valuations.
SMOT tracks the Morningstar US Small-Mid Cap Moat Focus Index, which is powered by Morningstar’s rigorous and forward-looking equity research process. Based on hypothetical data, the index has historically outperformed both broad SMID-cap and large-cap US equity markets (Chart 5).
Chart 5: Cumulative Index Returns: 1/4/2011 – 31/3/2023
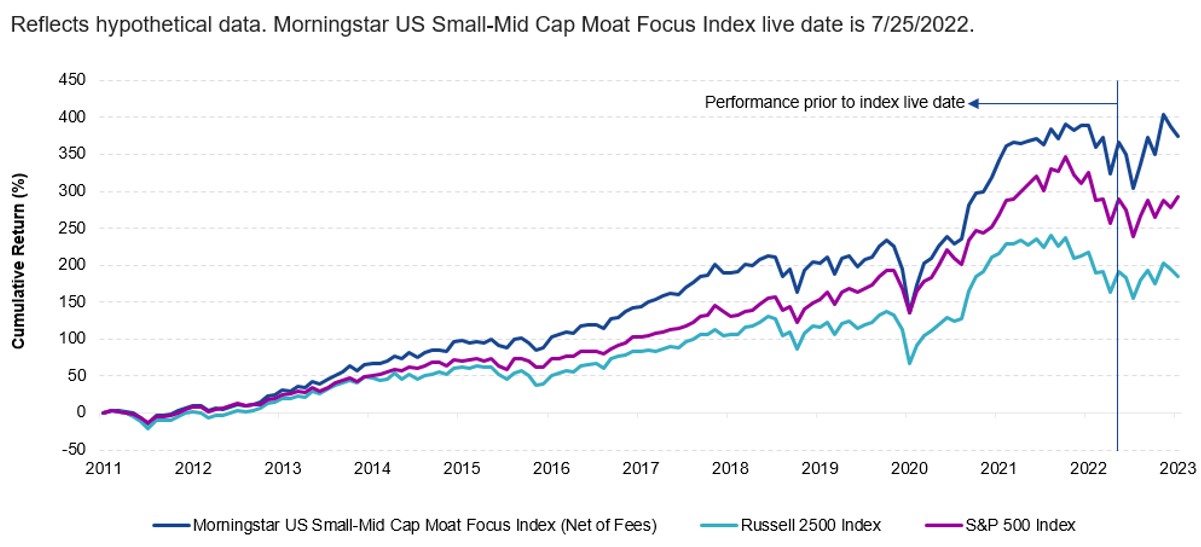
Source: Morningstar. Past performance is no guarantee of future results. More current performance may be lower than the advertised performance. Annual expense of 0.49% has been deducted from Morningstar US Small-Mid Cap Moat Focus Index performance. VanEck Morningstar SMID Moat ETF (SMOT) is a new product, and prior to 4/10/2022 had no operating history. Index performance is not illustrative of fund performance. Morningstar US Small-Mid Cap Moat Focus Index was not live prior to 25/7/2022, and any performance prior to this date is hypothetical. Hypothetical index data is based on criteria applied retroactively with the benefit of hindsight and knowledge of factors that may positively affected its performance and cannot account for all financial risks that may affect the actual performance of SMOT, which may vary significantly from this data. To simulate an initial construction for the index composition, selection buffers were not applied at the June 2022 reconstitution of the Index. Morningstar Index methodology can be accessed by visiting https://indexes.morningstar.com. Indices are unmanaged and are not securities in which investments can be made.
Table 1: Trailing returns
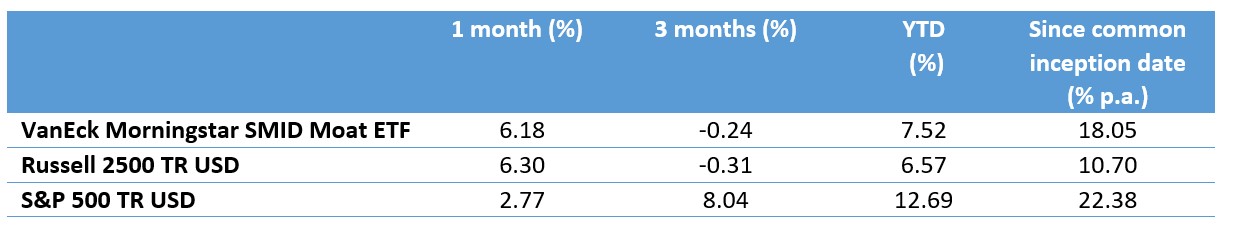
Source: VanEck. Data as of 8 June 2023. Inception date of SMOT is 4 October 2022. For illustrative purposes only. Past performance is not necessarily indicative of future performance. More current performance may be lower than the advertised performance. ETF returns assume that dividends and capital gains distributions have been reinvested in the fund at NAV and are net of fund expenses but do not include brokerage costs or bid/ask spreads. ETF returns reflect temporary contractual fee waivers and/or expense reimbursements. Had the ETF incurred all expenses and fees, investment returns would have been reduced.
Access the opportunity
Built around Morningstar’s proven moat investing philosophy and equity research, the VanEck Morningstar SMID Moat ETF (SMOT) provides exposure to SMID-cap moat stocks.
Key points of SMOT:
- Invests in US small- and mid-cap companies with long-term competitive advantages
- Targets companies trading at attractive prices
- Powered by Morningstar’s rigorous and forward-looking equity research
Fund snapshots:

' d='M0 0h300v57H0z'/%3e%3c/svg%3e "sgFsmLogoEnIcon")


'%3e%3cpath fill='%23fff' d='M0 0h21.6v21.6H0z'/%3e%3cg data-name='141-singapore'%3e%3cpath data-name='Rectangle 6502' fill='%23f0f0f0' d='M0 0h22v22H0z'/%3e%3cpath data-name='Rectangle 6503' fill='%23d80027' d='M0 0h22v10H0z'/%3e%3cg data-name='Group 21092' fill='%23f0f0f0'%3e%3cpath data-name='Path 14455' d='M2.917 5.365A3.128 3.128 0 015.374 2.31a3.128 3.128 0 100 6.11 3.128 3.128 0 01-2.457-3.055z'/%3e%3cpath data-name='Path 14456' d='M6.939 2.46l.222.683h.718l-.581.422.222.683-.581-.422-.581.422.222-.683-.581-.422h.718z'/%3e%3cpath data-name='Path 14457' d='M5.193 3.801l.222.683h.718l-.581.422.222.683-.581-.422-.581.422.222-.683-.581-.422h.718z'/%3e%3cpath data-name='Path 14458' d='M8.68 3.801l.222.683h.718l-.581.422.222.683-.581-.422-.581.422.222-.683-.581-.422h.718z'/%3e%3cpath data-name='Path 14459' d='M8.01 5.811l.222.683h.718l-.581.422.222.683-.581-.422-.581.422.222-.683-.581-.422h.718z'/%3e%3cpath data-name='Path 14460' d='M5.863 5.811l.222.683h.718l-.581.422.222.683-.581-.422-.581.422.222-.683-.581-.422h.718z'/%3e%3c/g%3e%3c/g%3e%3c/g%3e%3c/svg%3e "singaporeIcon")
' d='M0 0h67v14H0z'/%3e%3c/svg%3e "msFooterLogoIcon")
